Most financial templates you find are either too basic to be useful or so tangled you give up after ten minutes. This one sits in the middle, where it should. You get a proper three-year model with monthly detail, and you drive the whole thing from a single Assumptions tab.
Here is how it works. You open the Assumptions tab and change the blue cells: your starting units, price, COGS percentage, payroll, rent, debt, tax rate, opening balances. That’s it. The income statement fills in. The balance sheet fills in. The cash flow fills in. Every ratio, every chart, every annual total recalculates on its own. You never type into the statements themselves, so nothing breaks.
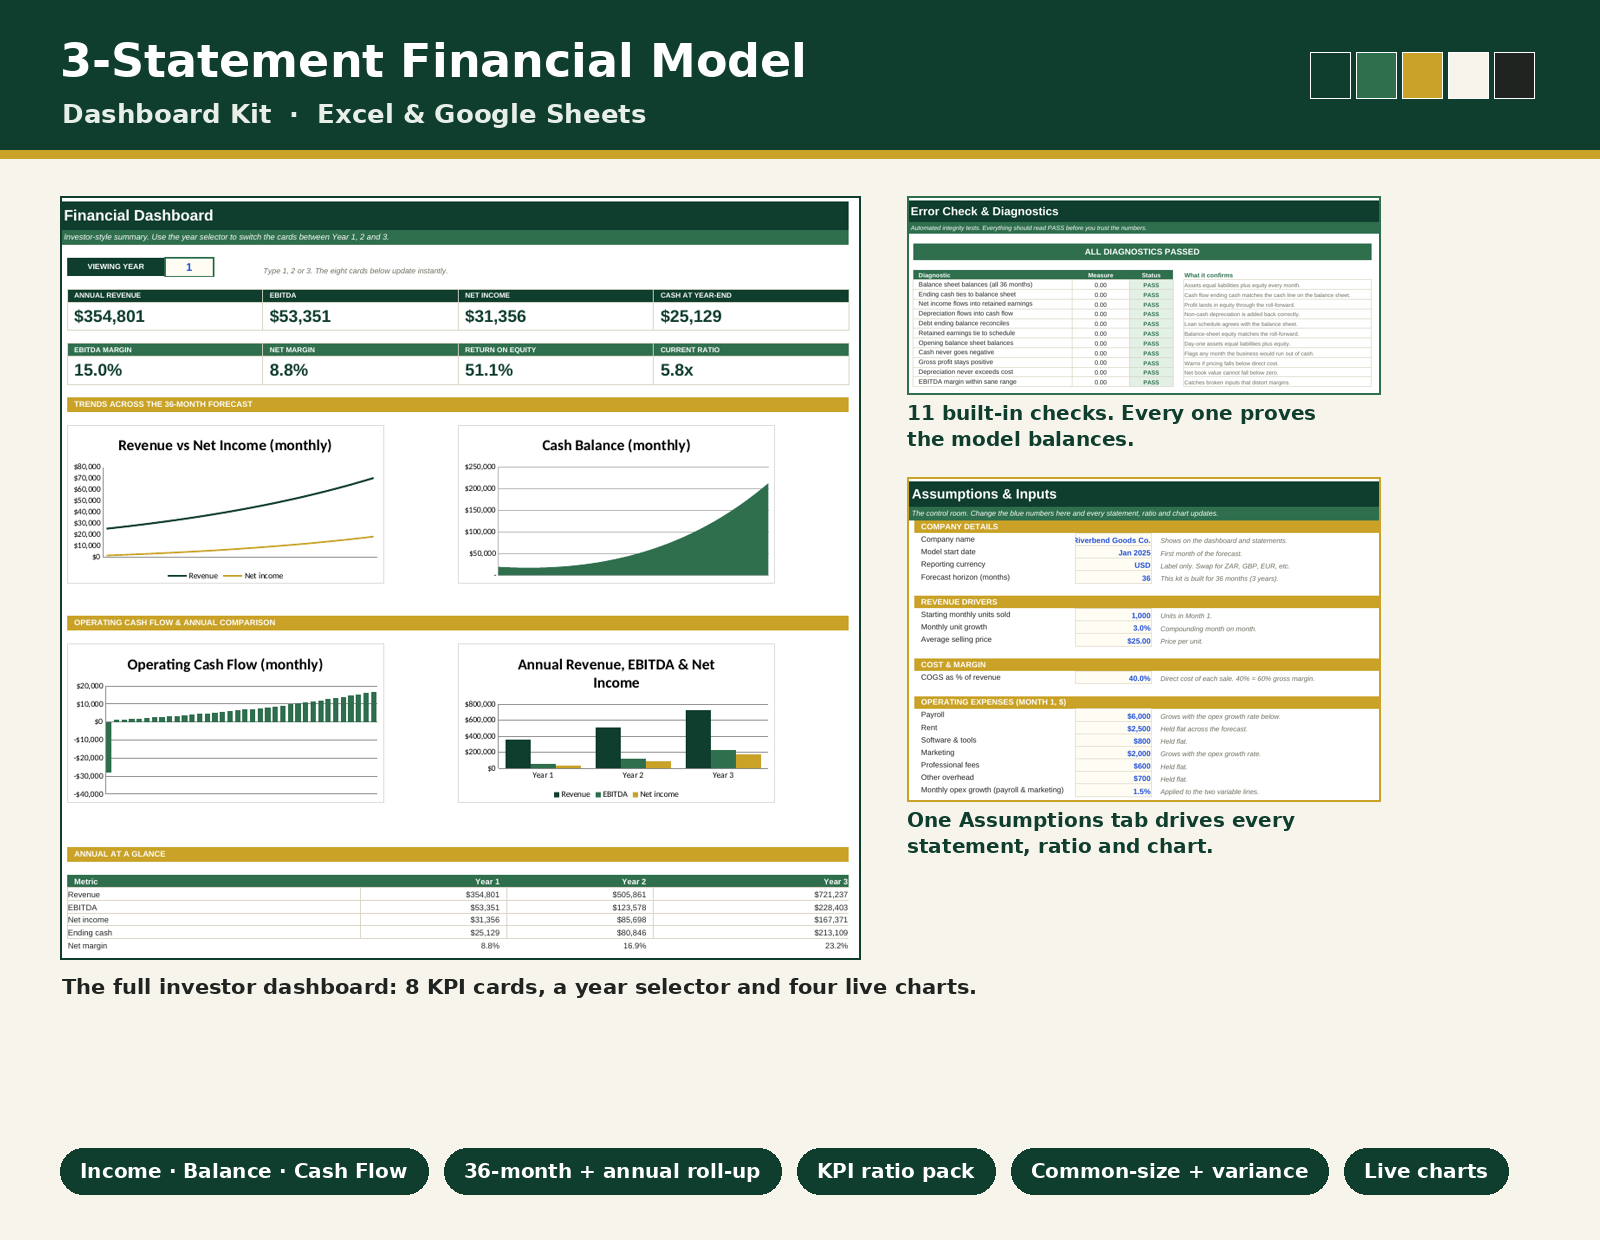
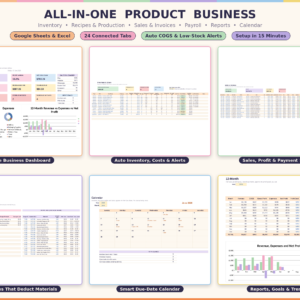
The dashboard is where it earns its keep. Eight KPI cards show revenue, EBITDA, net income, year-end cash, margins, return on equity and current ratio. A year selector lets you flip the cards between Year 1, 2 and 3 with a single click. Below that, four live charts track revenue against net income, your cash balance month by month, operating cash flow, and a clean annual comparison across all three years.
What really sets this apart is the Error Checks tab. Eleven automated tests run quietly in the background and confirm the model holds together: the balance sheet balances every single month, cash never silently goes negative, retained earnings tie back to the schedule, depreciation never exceeds cost, and more. When every line says PASS, you know the numbers are sound. No guessing.
Here’s what’s inside:
19 linked worksheets, all driven by one Assumptions tab
36-month income statement, balance sheet and indirect cash flow
Annual roll-up with a full three-year view
Investor-style dashboard with 8 KPI cards, 4 charts and a year selector
KPI ratio pack covering margins, liquidity, leverage and efficiency
Common-size statements and year-over-year variance analysis
Eleven built-in diagnostics that prove the model balances
Supporting schedules for revenue, operating expenses, working capital, debt, fixed assets and tax
Colour-coded cells so you always know what to touch: blue for inputs, black for formulas, green for links
A Start Here cover and a full Instructions tab with a guide to every sheet
It opens in Excel, and it opens in Google Sheets. Upload the file to Google Drive, open it with Sheets, and everything carries over, formulas and charts included. Keep the tab names as they are and the links between sheets just work.
This is a digital download. Nothing ships. You get the file straight after purchase and it’s yours to use on as many of your own projects as you like. Whether you’re putting together a budget, prepping for a loan conversation, pitching an investor, or just want to see where your business is heading, you plug in your numbers and the model does the rest.
A quick honest note: this models your business from your assumptions. The starter numbers are there as an example, so swap them for your own. The math is built and checked. The story it tells is up to you.
Reviews
There are no reviews yet.