A 52 week savings challenge printable is a simple idea that works because it starts small. You save $1 in week one, $2 in week two, and keep going until you save $52 in the last week of the year. Color a row each time. By the end you have $1,378 and a chart full of proof that you can stick with something.
The trouble is that the classic version does not suit everyone. Some people get paid every two weeks. Some have income that jumps around. Plenty of people quit in November, when the weekly amounts are biggest and the holidays are pulling the other way. So below you will get a free printable to start with, then 22 different ways to run the challenge, with the real numbers for each one.
Download the free 52 week savings challenge printable
Enter your email and the PDF downloads straight away. It is US Letter size, prints well on a home printer and is also fillable on screen.
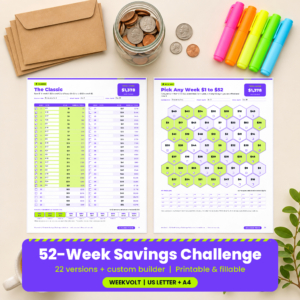
Free 52-Week Savings Challenge Printable (Classic Chart + Pick Any Week Grid)
A fillable, printable US Letter PDF with the classic $1 to $52 chart (running totals and 10% milestones) and a Pick Any Week hexagon grid. Both total $1,378.
Want everything unlocked?
The free file is a sample. The full version has every page, tab and feature, plus the user guide.
See the full versionWhat you get in the free download
- The Classic chart. All 52 weeks from $1 to $52, with a checkbox, a date line, the amount to save and the running total on every row. You never have to add anything up.
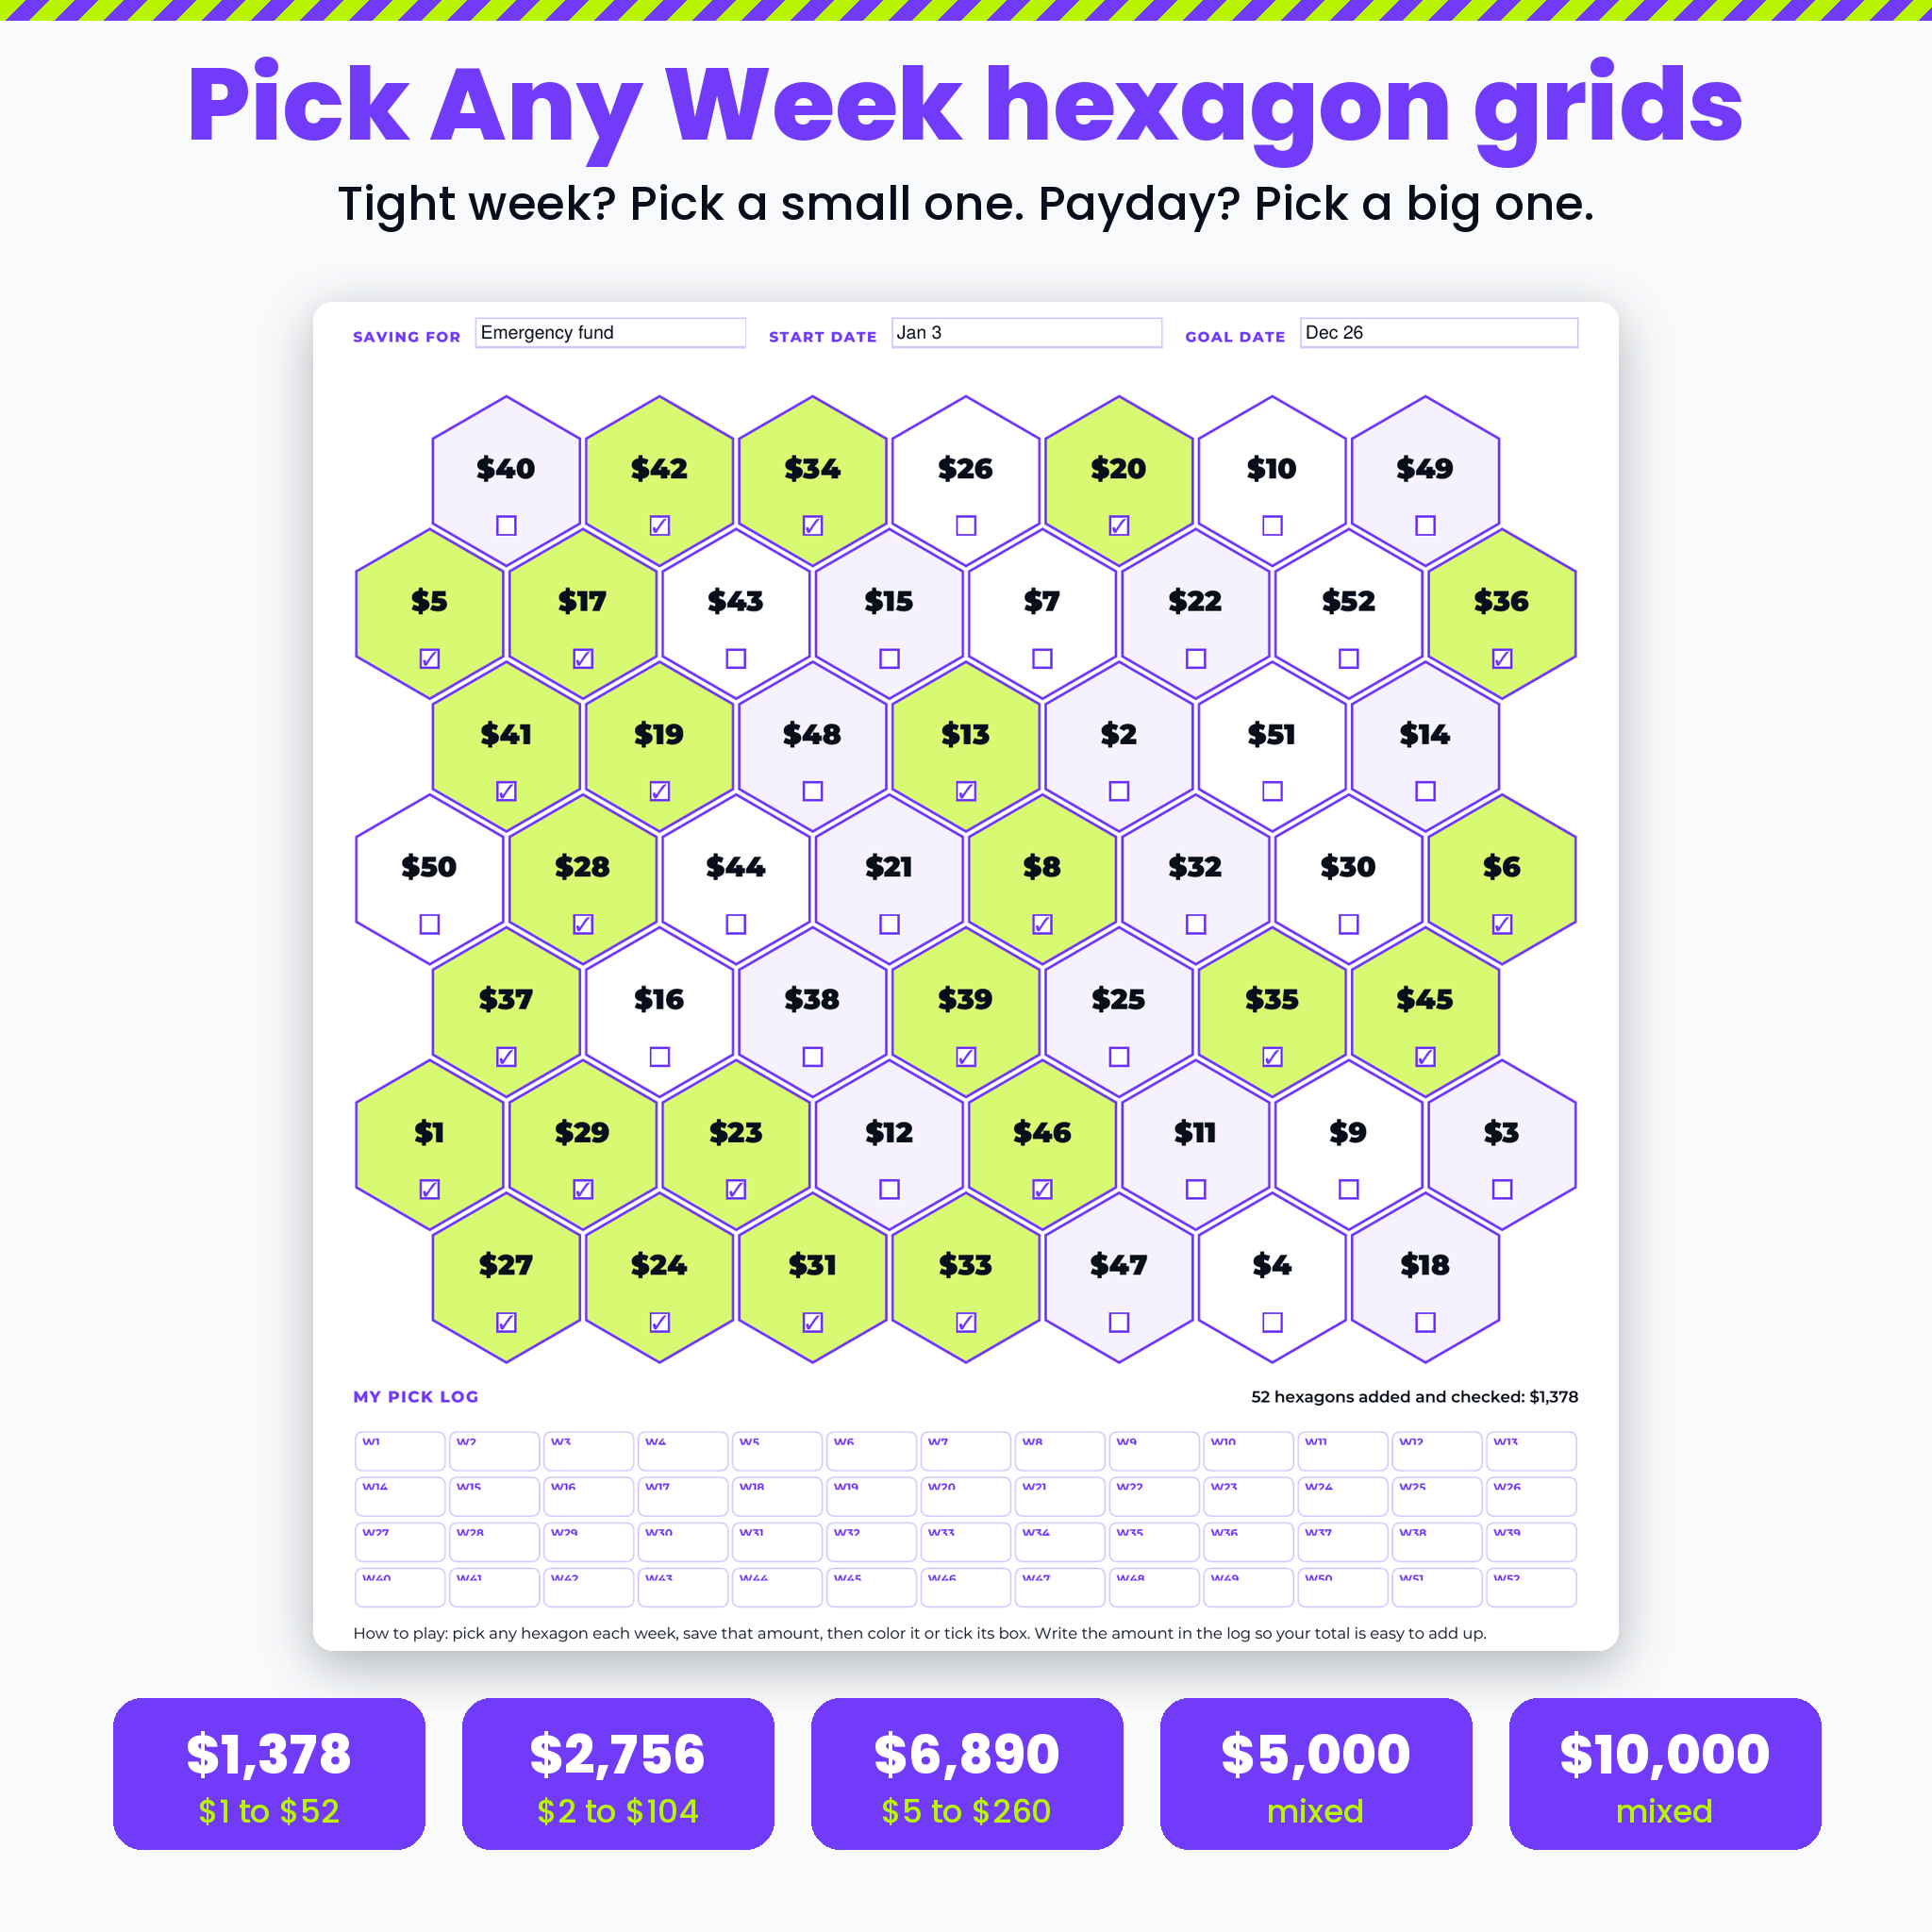
- A Pick Any Week hexagon grid. The same 52 amounts, scrambled into a honeycomb. Each week you pick any hexagon you can afford and color it. It still adds up to $1,378.
- A 10% milestone strip under the classic chart, with the week you reach each milestone if you save in order.
- Fillable fields for every checkbox, date and the “saving for” line, so you can track it on a tablet or laptop if you prefer.
Both pages come from the Weekvolt 52-Week Savings Challenge Variations Pack, which has 22 charts in total plus a custom builder. More on that further down.
How the 52 week money challenge adds up
The math behind the classic challenge is neat. The weekly amounts are 1 + 2 + 3 + … + 52. Add the first and last week ($1 + $52 = $53), multiply by the 26 pairs, and you get $1,378.
What most posts skip is how unevenly that money is spread across the year:
| Weeks | Saved in those weeks | Running total | Share of the total |
|---|---|---|---|
| 1 to 13 | $91 | $91 | 7% |
| 14 to 26 | $260 | $351 | 19% |
| 27 to 39 | $429 | $780 | 31% |
| 40 to 52 | $598 | $1,378 | 43% |
Look at the last row. Almost half of the total is saved in the final 13 weeks, which run from the end of September to the end of December (if you start in January). That is exactly when costumes, Thanksgiving groceries, gifts and travel show up. If you have ever started the challenge with great energy and stalled around week 45, this table is why. It is not a willpower problem. It is a design problem, and you can fix it by choosing a different version.
22 ways to run the 52 week savings challenge
Here are the main versions, sorted by how much they ask of you each week on average. The average is simply the total divided by 52 weeks, which makes it easy to compare a weekly chart with a biweekly one.
| Version | How it works | Total | Average per week |
|---|---|---|---|
| Half Step | 50 cents more each week, up to $26 | $689 | $13.25 |
| Flat $10 a week | The same $10 every week | $520 | $10.00 |
| Flat $25 a week | The same $25 every week | $1,300 | $25.00 |
| Classic | $1 more each week, up to $52 | $1,378 | $26.50 |
| Reverse | $52 down to $1 | $1,378 | $26.50 |
| Biweekly Classic | Two weeks paired into each payday: $3, $7, $11 up to $103 | $1,378 | $26.50 |
| Double Up | $2 more each week, up to $104 | $2,756 | $53.00 |
| Paycheck Step | $10 more each payday, up to $260 | $3,510 | $67.50 |
| Flat $100 a week | The same $100 every week | $5,200 | $100.00 |
| The $5 Step | $5 more each week, up to $260 | $6,890 | $132.50 |
| $10K Quarter Ladder | 13 weeks each at $120, $170, $210 and $270 (last week $260) | $10,000 | $192.31 |
The full pack also has flat $20 and $50 a week, flat $50, $100 and $200 a payday, a Double Up Reverse, and five Pick Any Week grids ($1,378, $2,756, $6,890, $5,000 and $10,000).
The Reverse: the fix for the December problem
Run the classic backward. Save $52 in week one, $51 in week two, and finish with $1 in the last week of December. The total is the same $1,378, but now the heavy lifting happens in January and February. Many people find this easier, because a fresh-start January feels like the right time to push. By the holidays, you are saving a few dollars a week and the hard part is behind you.
Flat weekly: for people who hate surprises
A flat challenge is the least exciting option, and that is its strength. You save the same amount every single week. $25 a week gives you $1,300 by the end of the year, almost the same as the classic, without the December spike. It also makes automation easy: set one recurring transfer and color a tile every Friday.
Biweekly: for every-other-Friday paychecks
If you are paid every two weeks, a 52-row chart can feel out of step. A biweekly chart has 26 rows, one per payday. The Biweekly Classic pairs weeks together (weeks 1 and 2 become $3, weeks 3 and 4 become $7) so you still finish at exactly $1,378. The Paycheck Step adds $10 every payday and reaches $3,510.
Pick any week: for uneven income
Freelancers, servers, rideshare drivers and anyone on commission know that some weeks are flush and some are thin. A pick any week grid puts all 52 amounts on the page in random order. On a good week you pick $48. On a rough week you pick $3. As long as you color one hexagon per week, the grid fills up and you reach the total. Try this with the free grid above.
Big goals: $5,000 and $10,000
For a house deposit, a car or a serious emergency fund, the step-up challenges get big fast. The $5 Step reaches $6,890, but its last week asks for $260. Two calmer routes: the $10K Quarter Ladder, which changes the weekly amount only four times a year, and the mixed-amount hexagon grids, where every amount sits between $100 and $300 and the grid adds up to exactly $10,000.
EDITOR’S PICK: THE FULL PACK
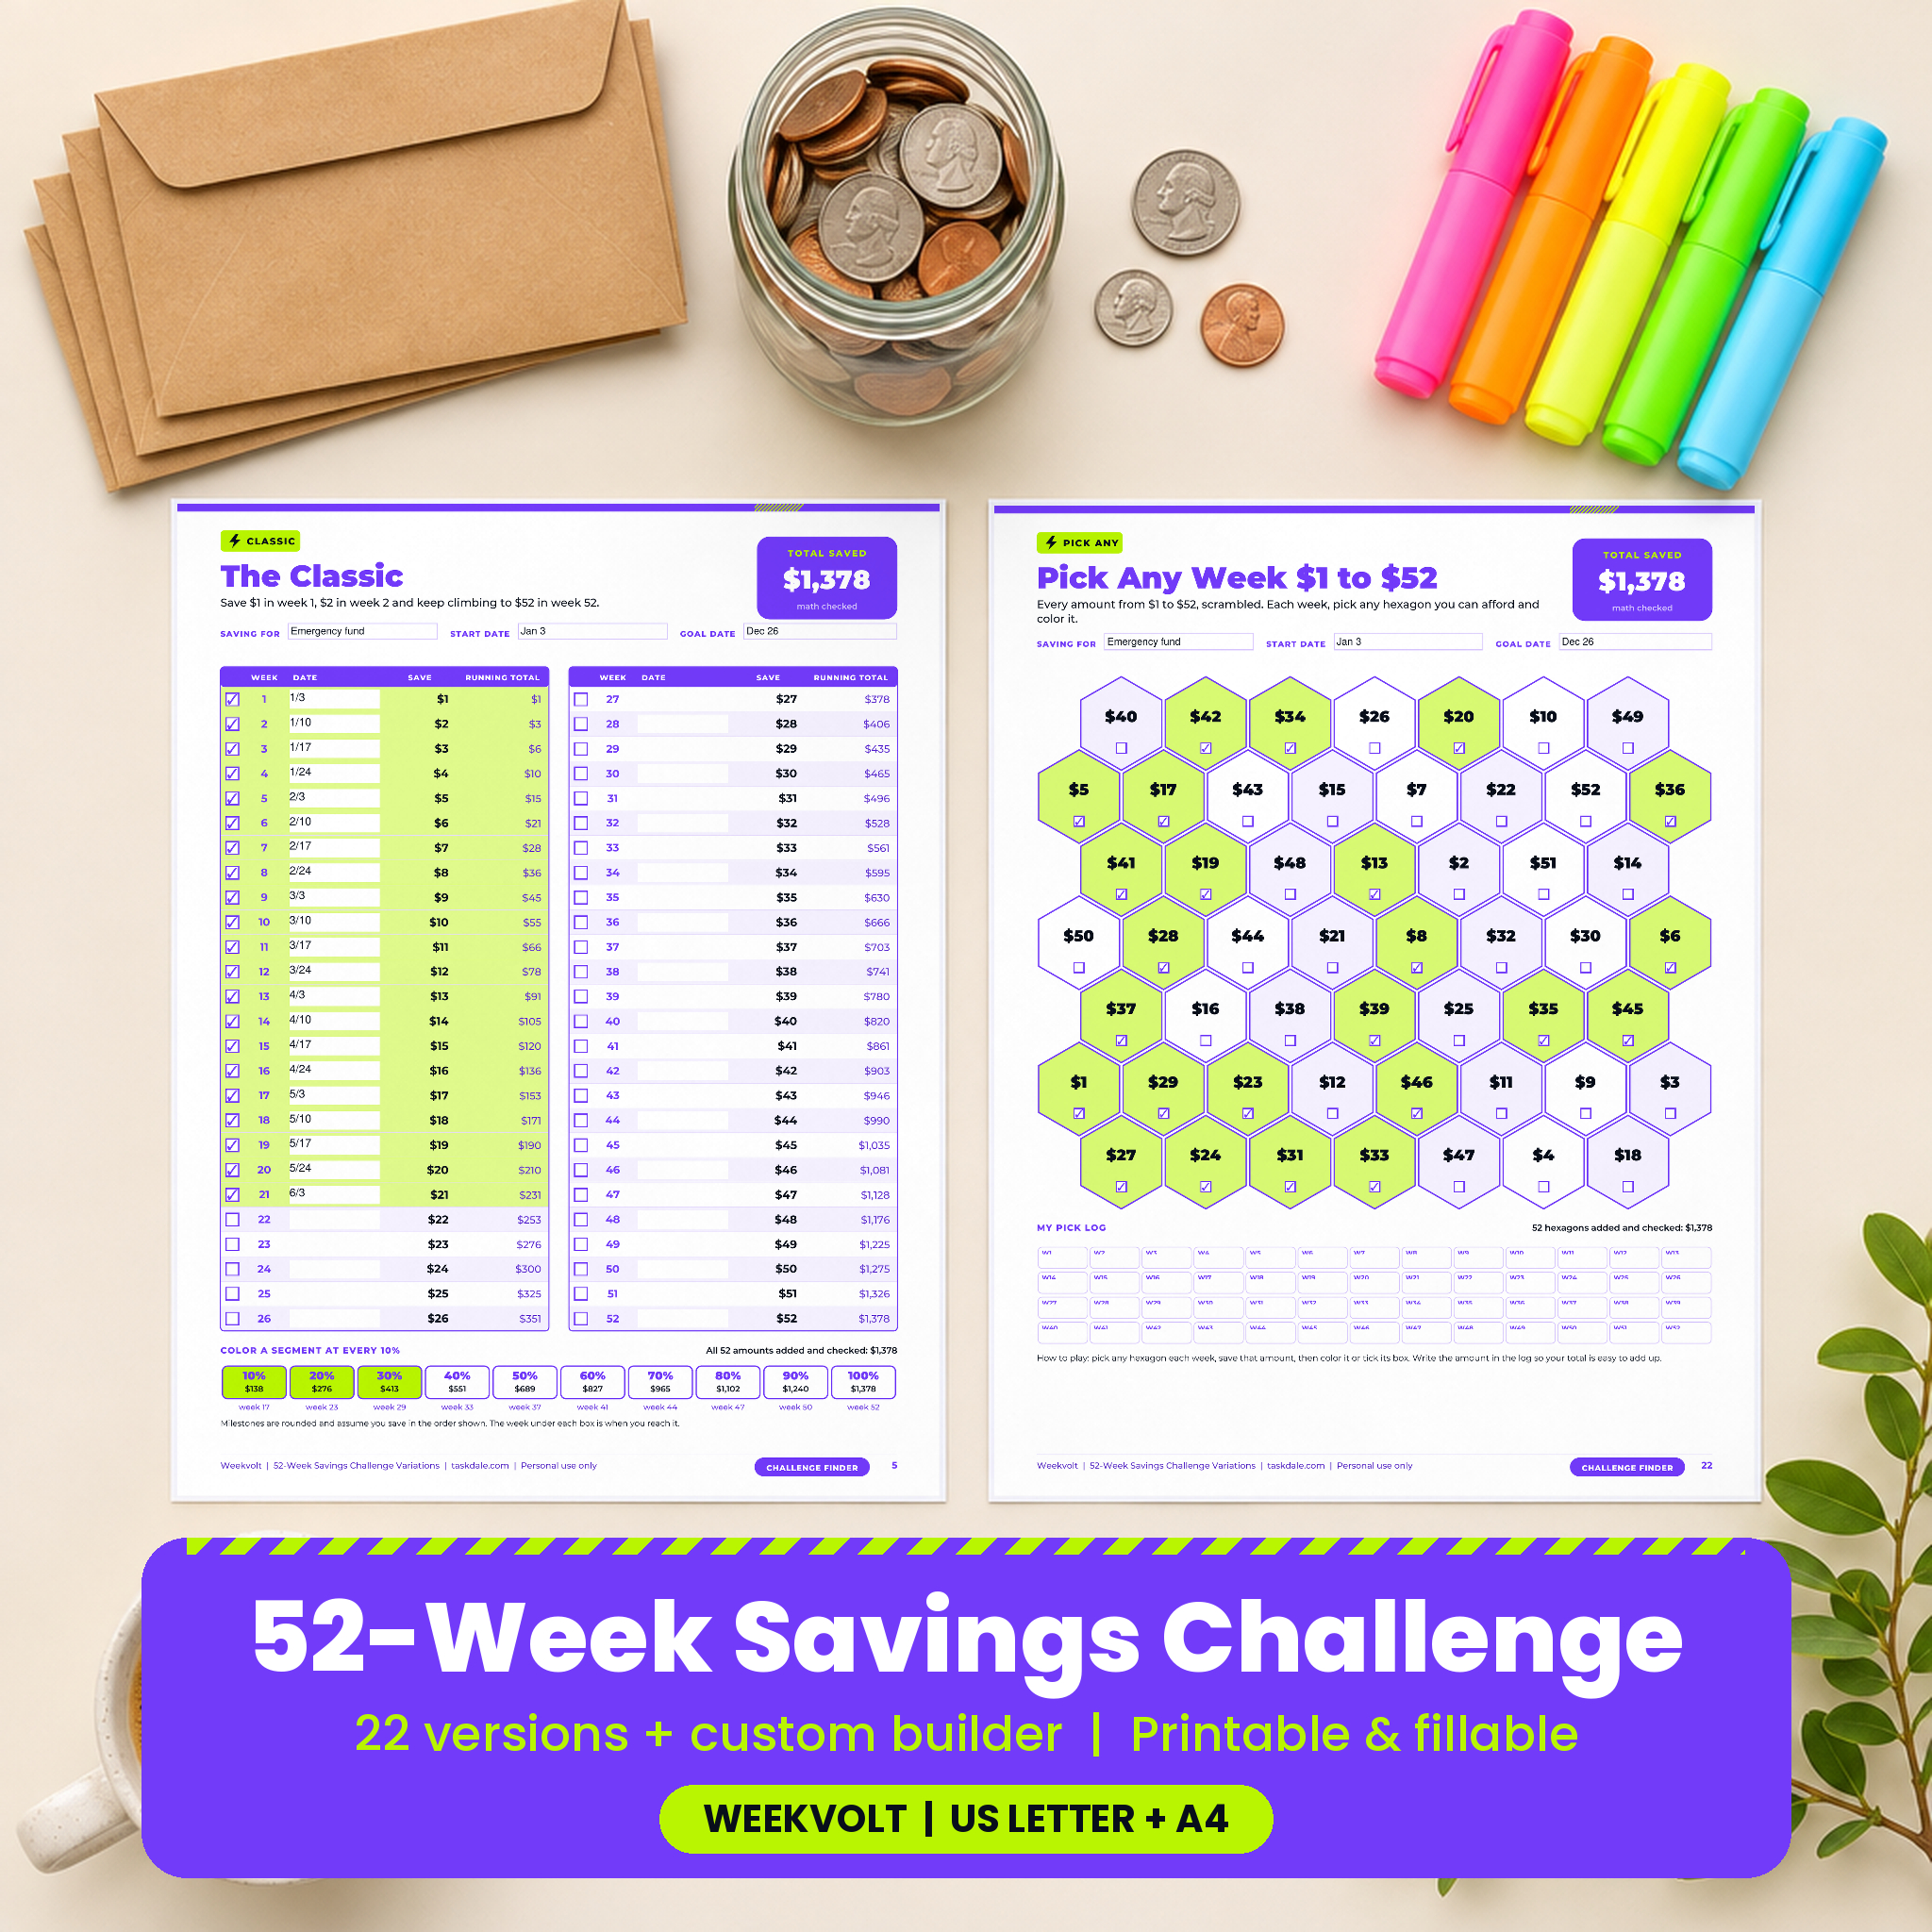
Weekvolt 52-Week Savings Challenge Variations Pack
22 versions of the 52-week challenge in one printable, fillable PDF. Every total printed and math checked.
- Classic, Reverse, Double Up, Double Up Reverse, $5 Step and Half Step charts
- Flat $10, $20, $25, $50 and $100 a week, laid out by quarter
- 5 biweekly payday charts, including a paired version of the classic
- 5 Pick Any Week hexagon grids, with exact $5,000 and $10,000 grids
- A $10K Quarter Ladder, Custom Builder, blank charts, Challenge Finder and certificate
- Printable and fillable, US Letter and A4
Which version should you choose?
The right version is the one you will finish. Use this three-step check:
- Find your comfortable weekly number. Look at the last two months of spending and find an amount you could move to savings every week without stress. Be honest, not hopeful.
- Match it to an average. Pick the version whose average per week (in the table above) is at or just below that number. If your number is $30, the Classic, Reverse or Flat $25 all fit.
- Match the rhythm to your income. Steady weekly pay suits the classic or flat charts. Biweekly pay suits the payday charts. Uneven pay suits the pick any week grids.
When in doubt, go one size smaller. Finishing a $1,300 challenge does far more for your confidence than giving up on a $5,000 one in April. You can always run a bigger version next year.
Work backward from a savings goal
Have a specific number in mind? Here is what it takes, rounded up to the next cent so you land on or just over the target. The step-up column means week one equals the raise and it grows by that same amount every week, like the classic $1, $2, $3.
| Target | Flat amount every week | Flat amount every payday (26) | Step-up raise (classic style) |
|---|---|---|---|
| $1,000 | $19.24 | $38.47 | $0.73 |
| $2,500 | $48.08 | $96.16 | $1.82 |
| $5,000 | $96.16 | $192.31 | $3.63 |
| $10,000 | $192.31 | $384.62 | $7.26 |
The formula behind the step-up column is handy if you want to design your own: 52-week total = 52 x first week + 1,326 x weekly increase. For paydays it is 26 x first payday + 325 x increase. The full pack has these formulas on a Custom Builder page, with quick tables and blank charts to copy your amounts into.
Tips that help people finish
- Pick a money moment. One fixed time each week, like Friday evening after payday, when you move the money and color the chart. Set a phone reminder.
- Move it out of sight. A separate high-yield savings account works better than a jar on the counter. Out of sight is out of reach.
- Save first, then color. Never color a row for money you plan to move later. The chart should only ever show money that is really there.
- Put the chart where you will see it. The fridge, the inside of a closet door, your desk. Seeing it daily keeps the streak alive.
- Celebrate milestones cheaply. A movie night at home at 25%, a new paperback at 50%. Small rewards keep you going without eating the savings.
- Bring a partner. Two people running two charts side by side, or one person per hexagon grid, adds a little friendly competition.
What to do if you miss a week
Everyone misses a week. A car repair, a birthday, a short paycheck. The worst thing you can do is decide the whole challenge is ruined. Instead, pick one of these:
- Double up next week. Fine for small amounts early in the year.
- Do it out of order. On a classic chart you can save a small week now and come back to the bigger week later. Tick off what you actually saved and keep the running total honest.
- Switch to a grid. If missing weeks becomes a pattern, copy what you have saved so far onto a pick any week grid and choose smaller hexagons when money is tight.
- Extend the finish line. Finishing in 56 weeks still beats stopping at 30.
Free sample vs the full Weekvolt pack
The free printable is a complete, usable challenge. If you want more versions, bigger goals or the A4 size, here is what the full pack adds:
| Feature | Free sample | Full Weekvolt pack |
|---|---|---|
| Classic $1 to $52 chart with running totals | ✓ | ✓ |
| Pick Any Week $1 to $52 hexagon grid | ✓ | ✓ |
| Fillable checkboxes and date fields | ✓ | ✓ |
| Reverse, Double Up, $5 Step and Half Step charts | ✗ | ✓ |
| Flat $10, $20, $25, $50 and $100 a week | ✗ | ✓ |
| 5 biweekly payday charts | ✗ | ✓ |
| $5,000 and $10,000 hexagon grids, $10K Quarter Ladder | ✗ | ✓ |
| Custom Builder, blank chart and blank hexagon grid | ✗ | ✓ |
| Challenge Finder, My Plan, Deposit Log, Year at a Glance | ✗ | ✓ |
| A4 size and certificate | ✗ | ✓ |
| User guide (DOCX) | ✗ | ✓ |
See all 22 versions on Taskdale
More savings printables and trackers
Running the 52-week challenge alongside something else? These Taskdale products pair well with it:
| Product | Best for |
|---|---|
| Coinmeadow Savings Challenge Bundle | A mix of challenge types: 100 envelope, penny, no-spend and color-in trackers |
| Foldpenny 100 Envelope Challenge | Cash stuffers who want the envelope version, with draw orders |
| Goalkeel Savings Goals Tracker | Tracking several goals in Excel or Google Sheets with charts |
| Kettlefund Sinking Funds Tracker | Saving for planned yearly costs like car repairs and gifts |
| Jarlings Kids Money Jar Pack | Teaching kids and teens to save, spend and share |
| Envelora Cash Stuffing Budget Spreadsheet | A full cash envelope budget with a 52-week challenge built in |
Frequently asked questions
How much money do you save with the 52 week savings challenge?
The classic version saves $1,378: $1 in week one, $2 in week two and so on up to $52. Other versions range from $520 (a flat $10 a week) to $10,000.
Is the 52 week challenge better in reverse?
For many people, yes. The total is the same, but you save the biggest amounts in January and February, when motivation is high, and the smallest amounts land in December.
Can I start the 52 week challenge in the middle of the year?
Yes. The charts are undated, so week 1 is whatever week you start. Write your own dates in the date column.
What if I miss a week?
Do not restart. Either double up the following week, or switch the rest of the year to a pick any week grid so you can fill the gaps when money is better.
Should I keep the money in cash or in the bank?
A separate savings account is safer and earns interest. Some people like a cash jar for the small weeks and a transfer for the big ones. Both work with the printable.
Is the free printable really free?
Yes. Enter your email, download the PDF and print it as often as you like for your own household.
Start this week
The best week to start the 52 week savings challenge is this one. Not January, not after the next paycheck. Print the free chart, write what you are saving for at the top, move $1 (or $52 if you are going reverse) and color your first row. Scroll back up to download the free printable, and when you are ready for more versions, the Weekvolt 52-Week Savings Challenge Variations Pack has 22 of them waiting.