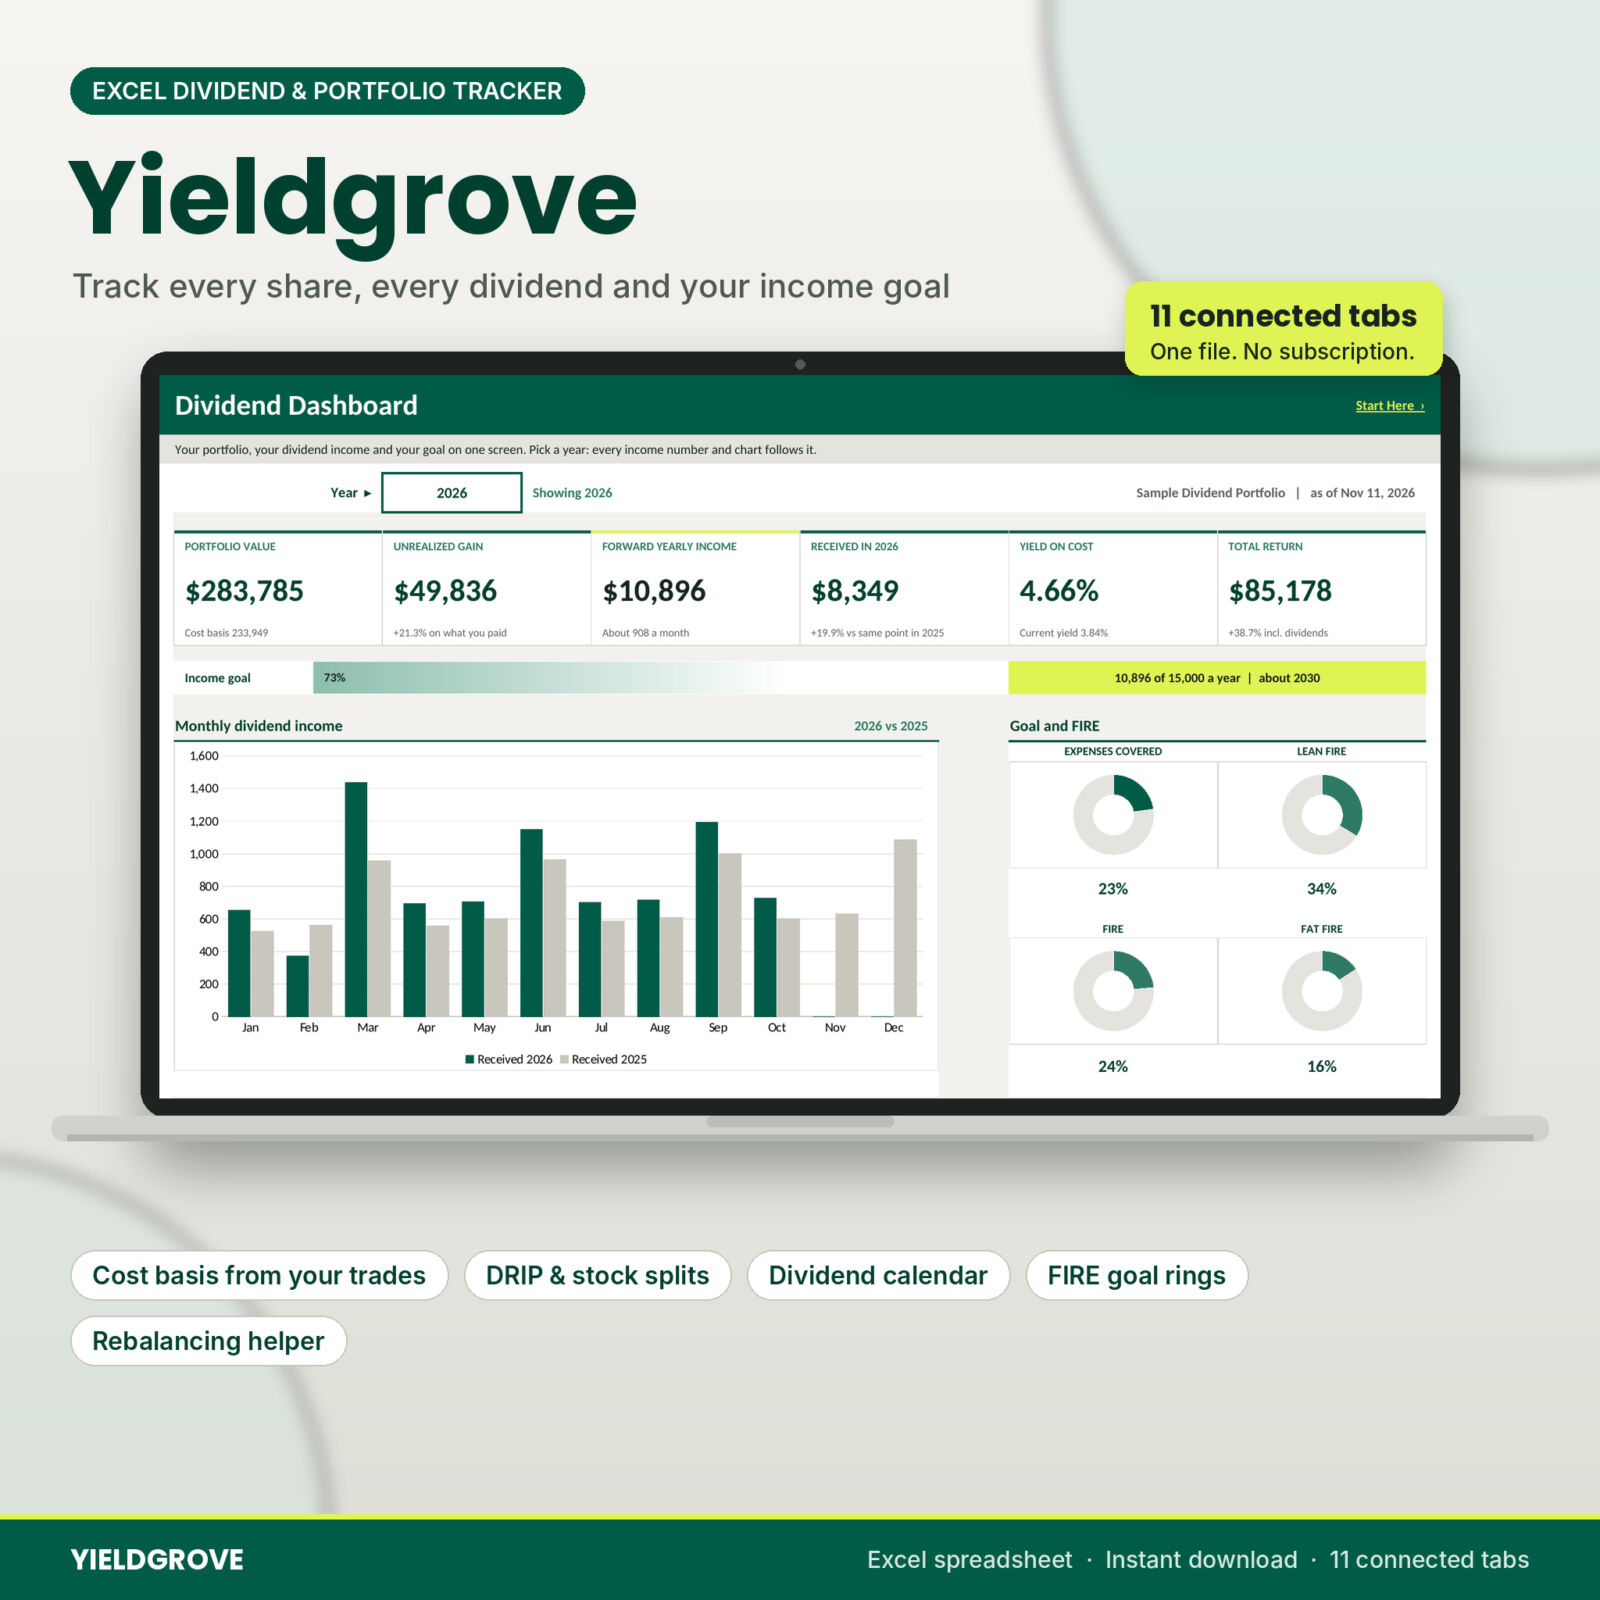

Yieldgrove is a dividend tracker spreadsheet and stock portfolio tracker for Microsoft Excel. You list your positions, log your trades and dividends as they happen, and type a current price when you want an update. The workbook does the math: shares held, average cost, cost basis, unrealized and realized gains, yield, yield on cost, forward yearly income, a 12-month dividend calendar, income by month and year, allocation by sector and account, rebalancing amounts and your progress toward an income goal and FIRE.
Eleven connected tabs and a Start Here page, all in one file. No monthly fee, no broker login.
What this dividend tracker spreadsheet does
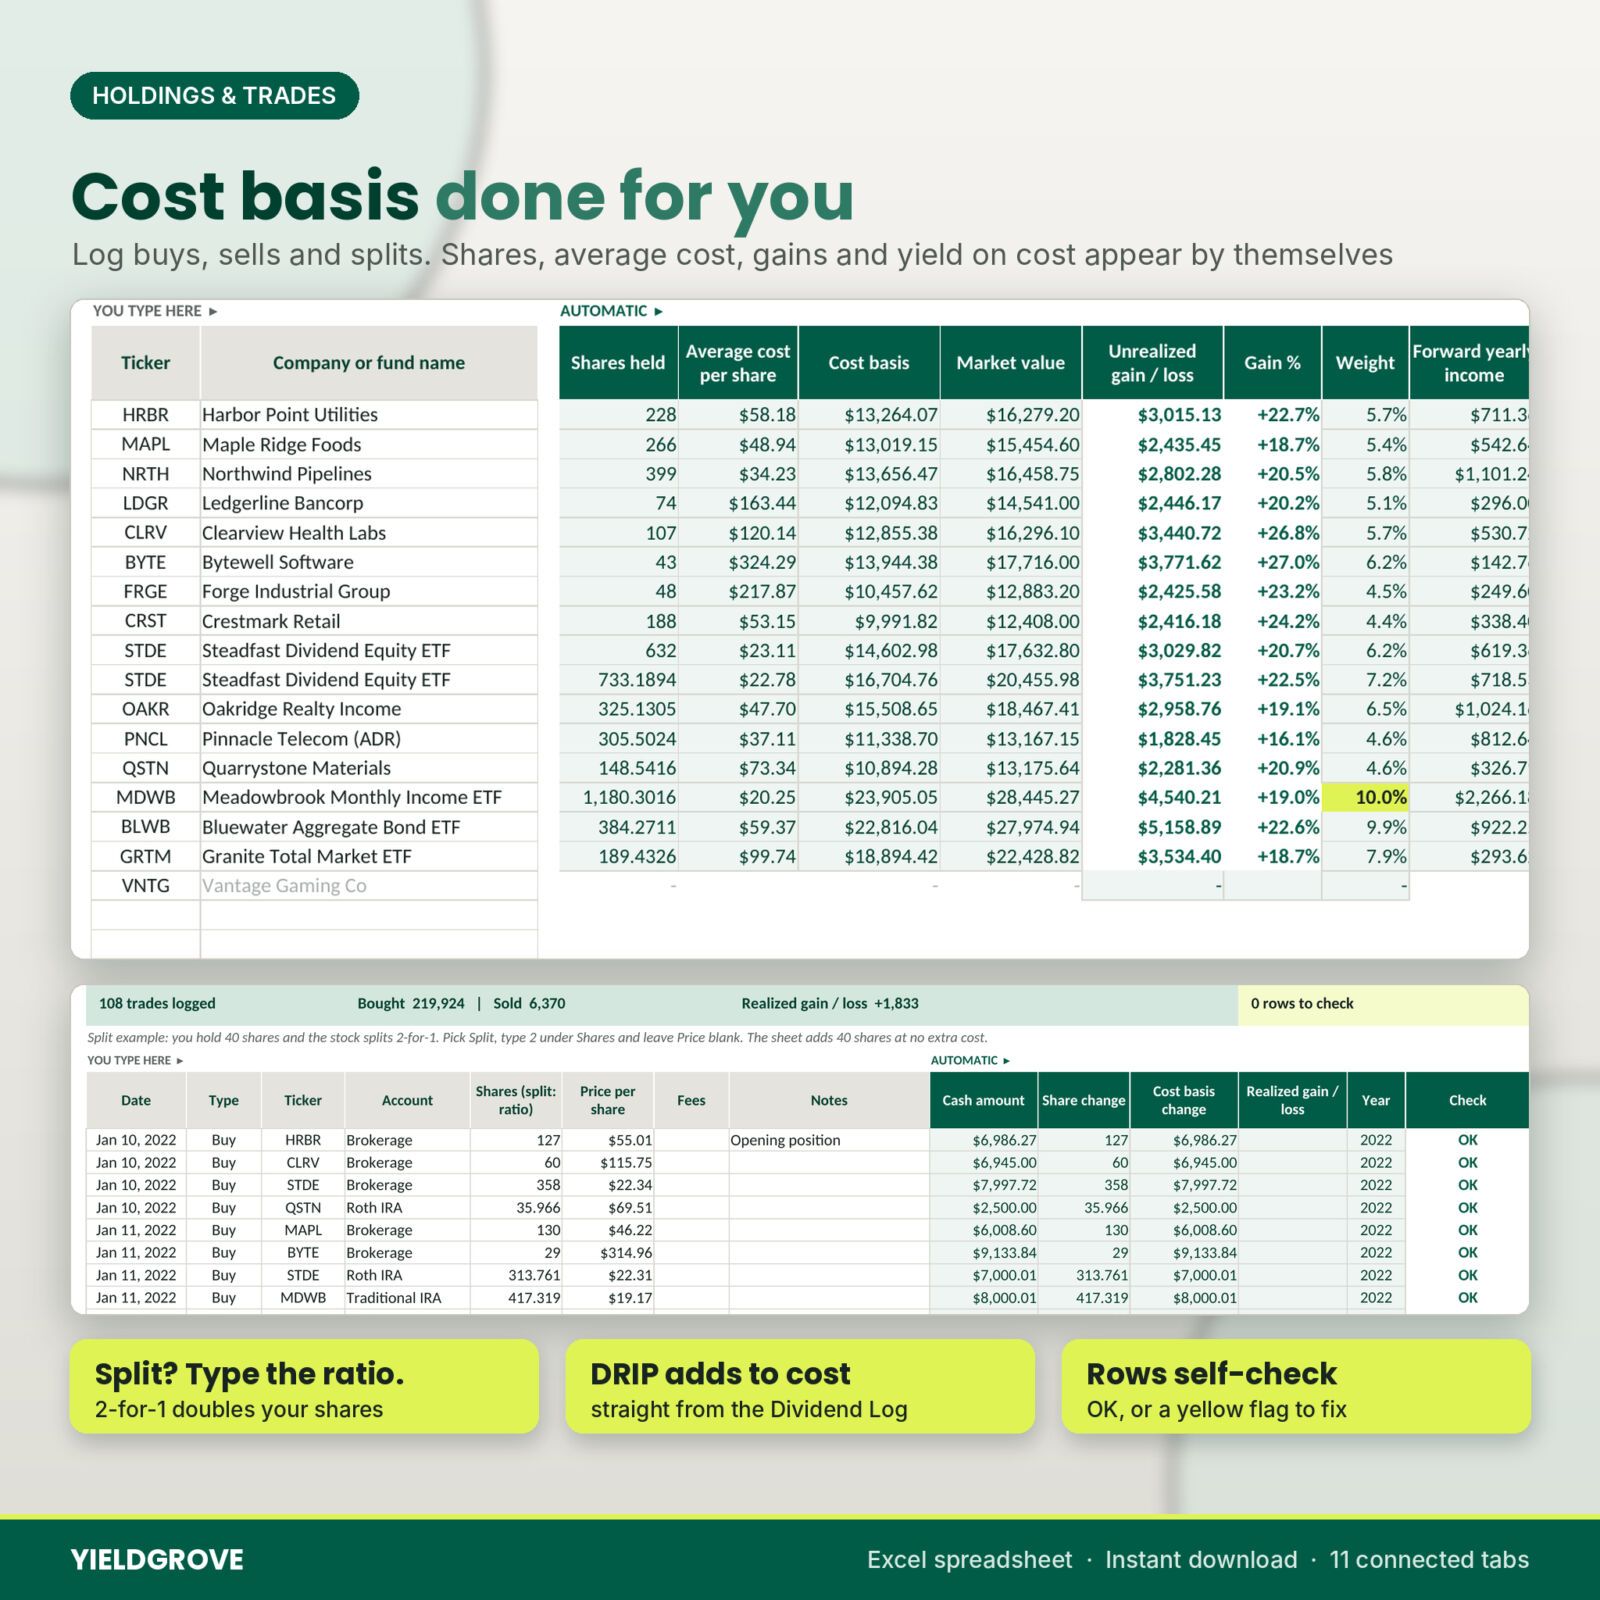
Most dividend trackers ask you to retype your holdings every month, or they only add up dividends. Yieldgrove starts from a real trade log, so your cost basis is right even after you add to a position, trim it, reinvest dividends or go through a stock split.
- Cost basis from your trades. Buys add their cost plus fees. Sales remove shares at your average cost and show the realized gain or loss.
- Reinvested dividends (DRIP). Type the fractional shares a dividend bought. They are added to the position and its cost basis, with no extra buy to log.
- Stock splits. Pick Split and type the ratio, for example 2 for a 2-for-1. Shares go up and your average cost drops in step.
- Yield on cost and forward income. See what each position pays today against what you paid for it.
- Every row checks itself. A missing price, an unknown ticker, a sale bigger than your shares or a renamed account gets a yellow flag so you can fix it.
Features
Dashboard
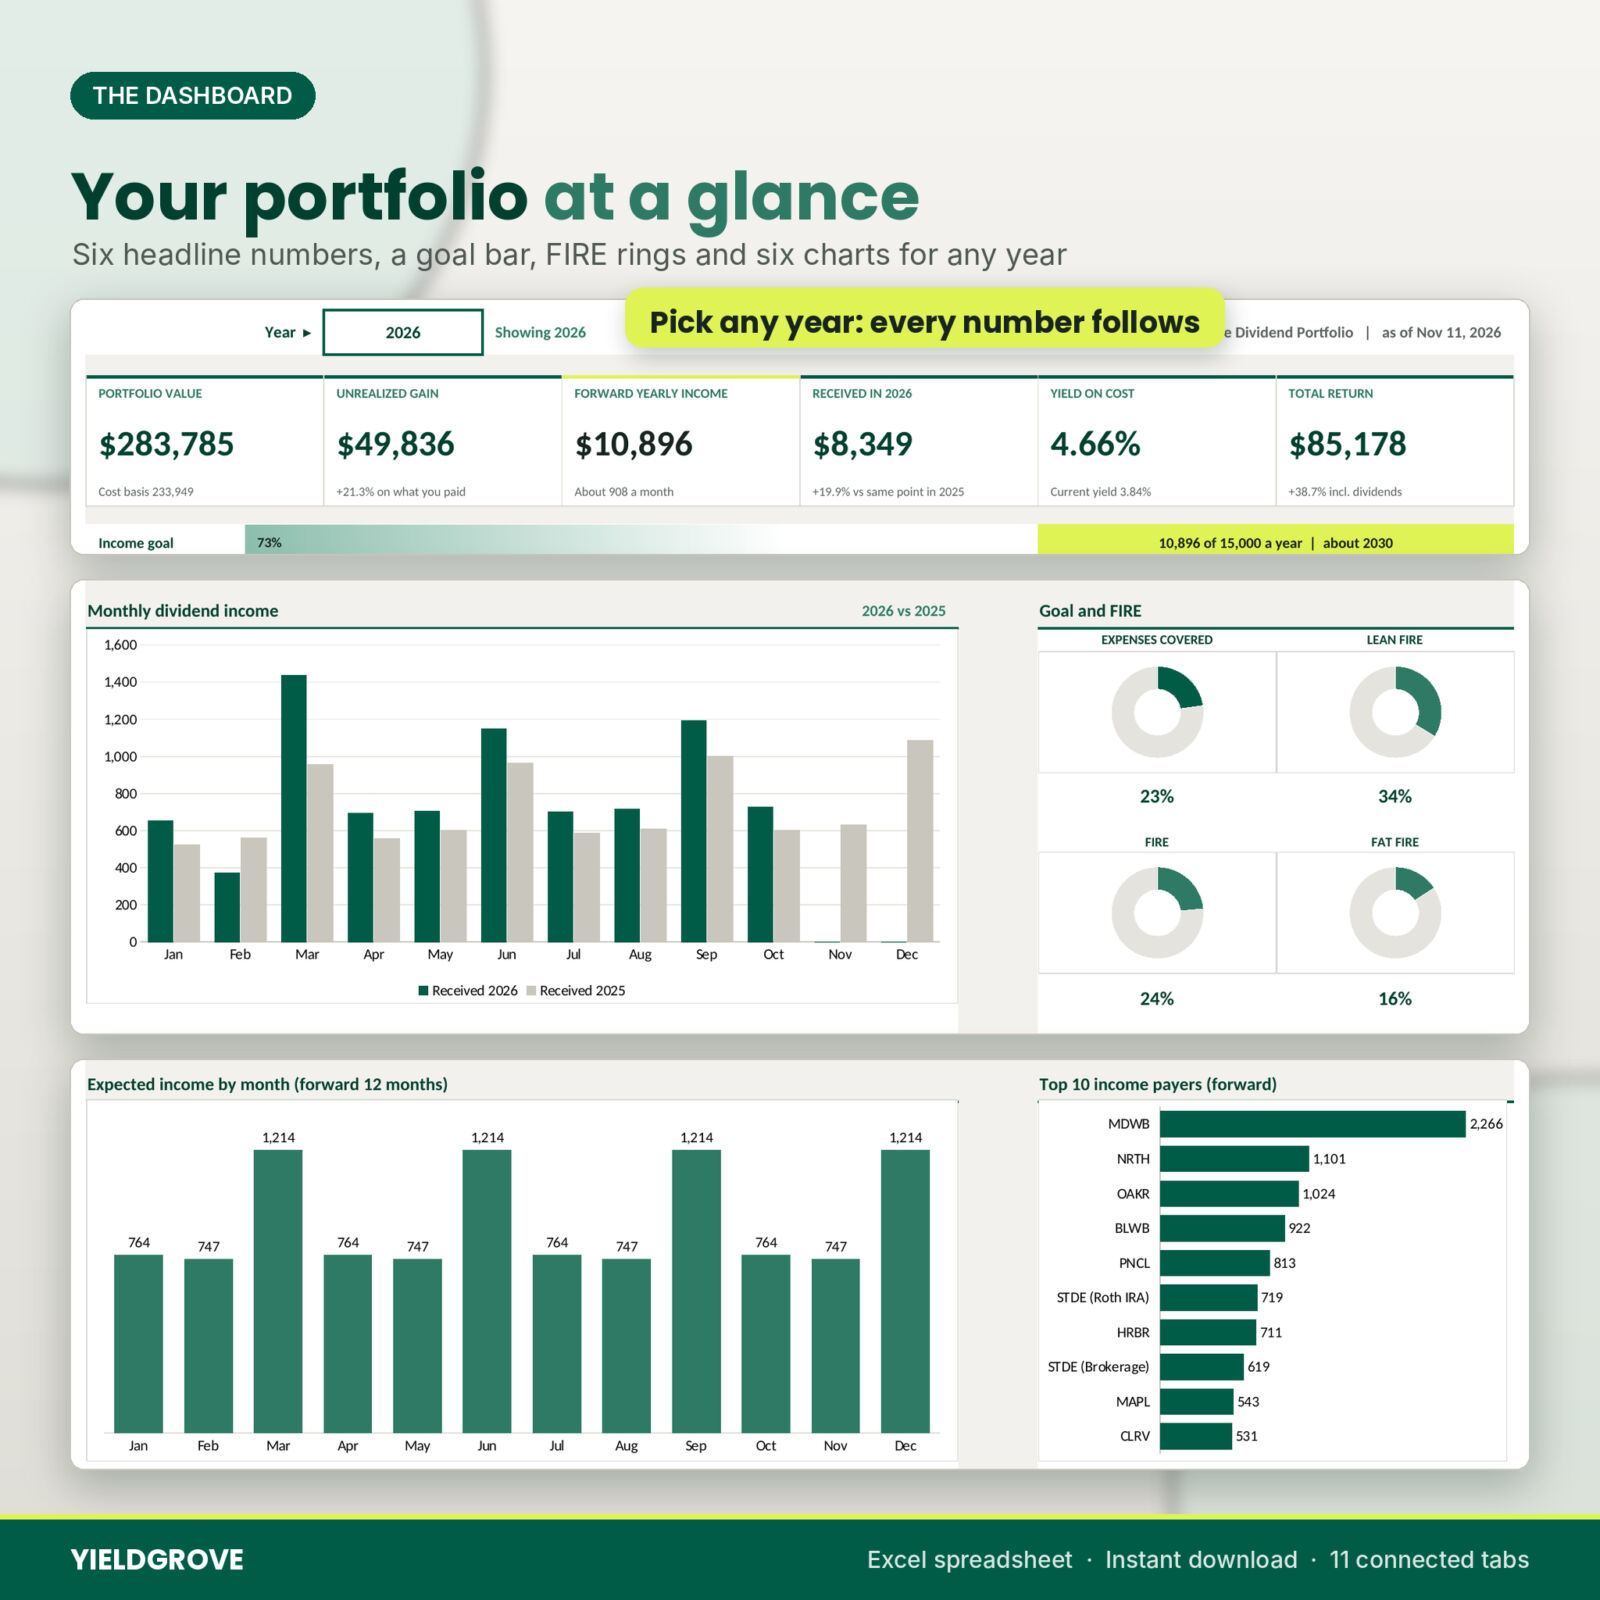
Portfolio value, unrealized gain, forward yearly income, dividends received this year (compared with the same point last year), yield on cost and total return. Below them: an income goal bar with the year your income could reach it, four FIRE rings, monthly income this year against last year, sector and account mix, expected income by month, your top 10 payers, the last five years of income, quick facts, your biggest positions and your latest dividends. Pick any year and the income numbers follow.
Dividend Calendar
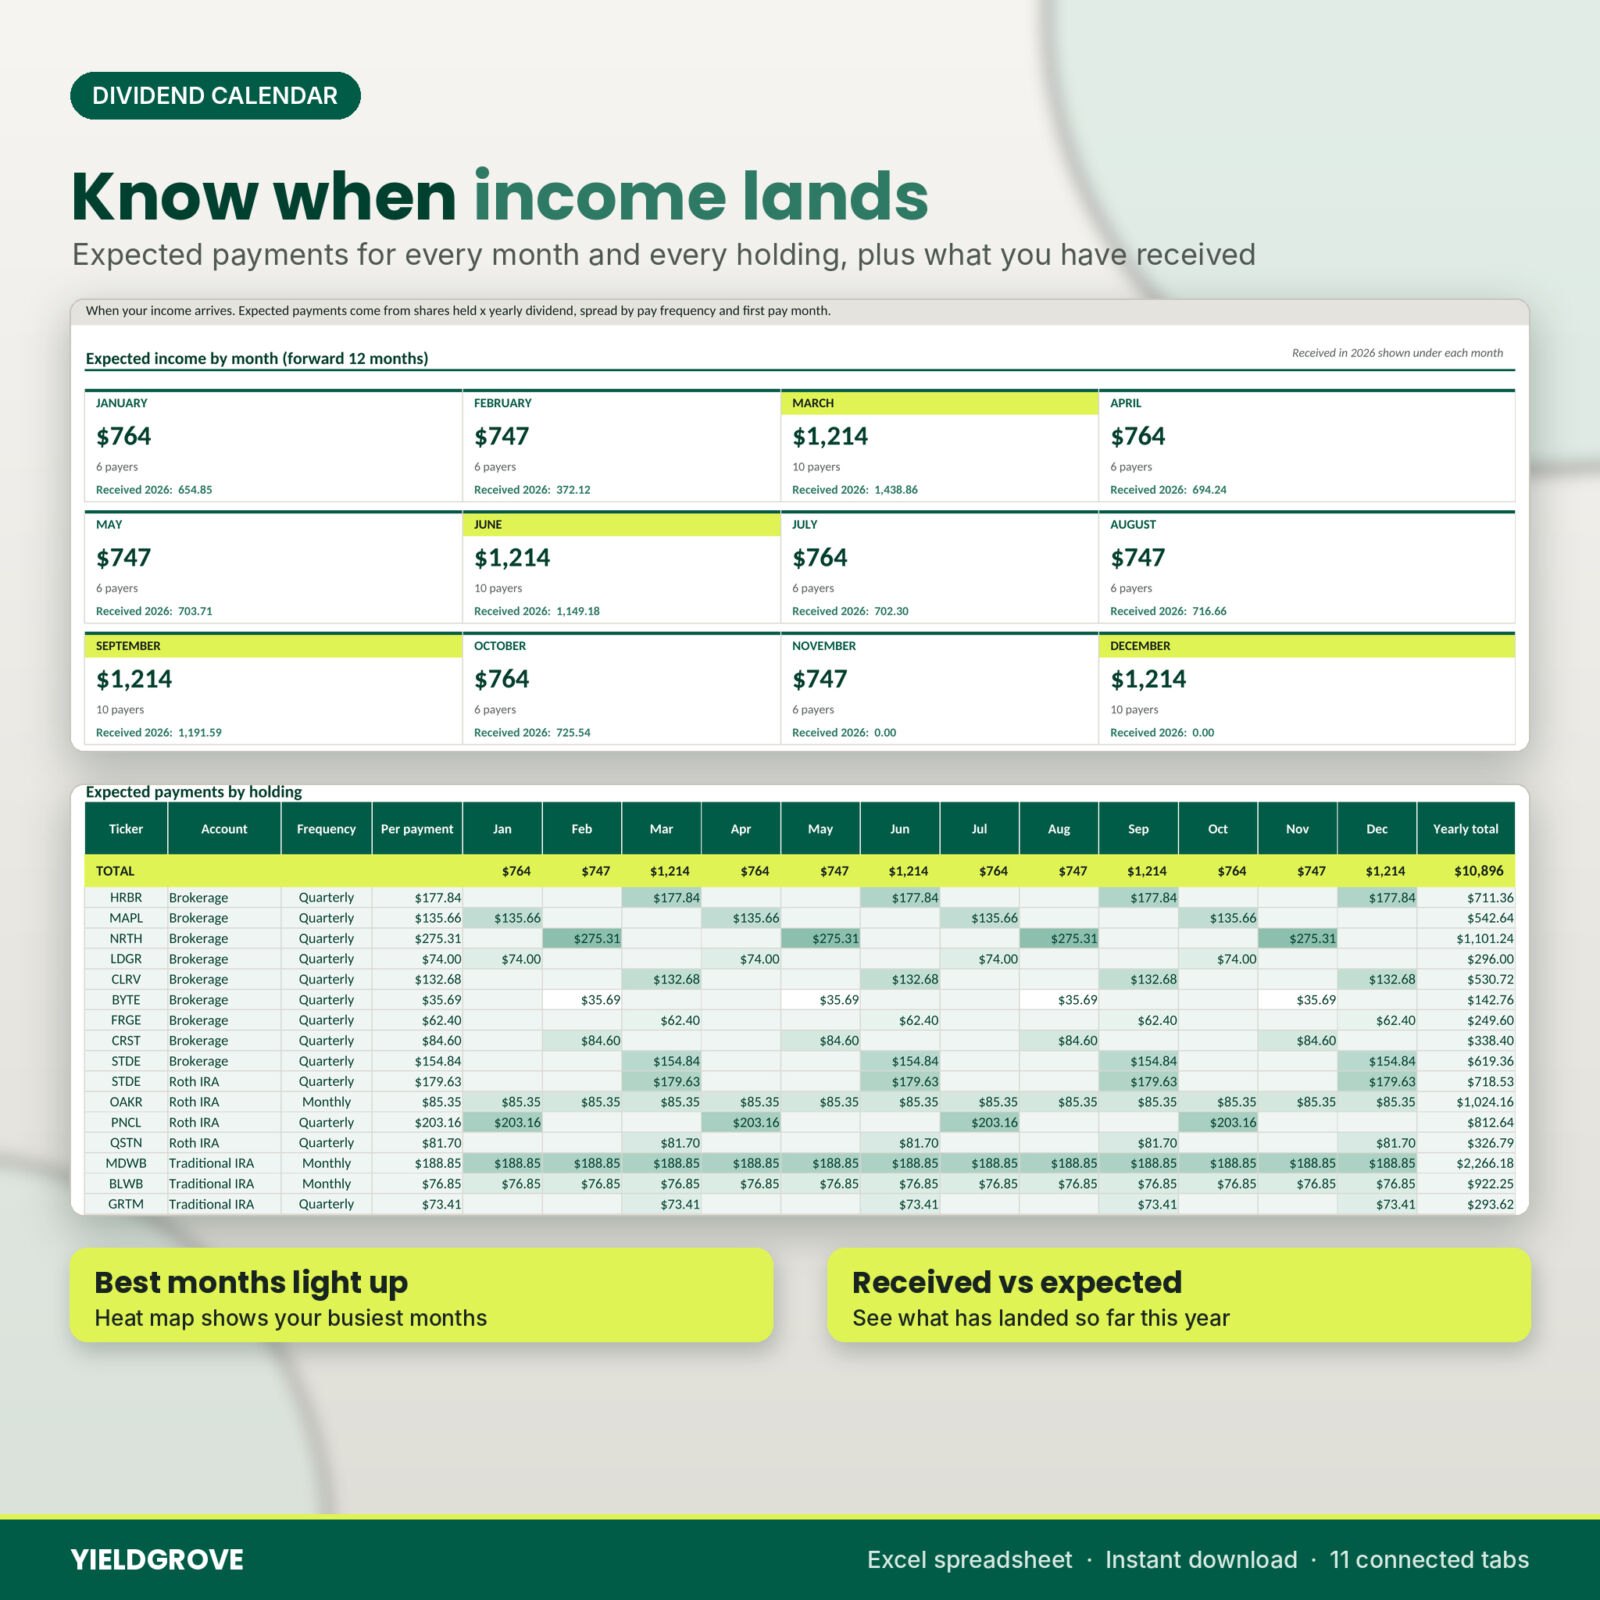
Twelve month cards show expected income, how many positions pay that month and what has landed so far. A heat map grid shows every expected payment by position and month, so you can see your busy and quiet months at a glance.
Income Summary
Ten years of dividend income by month with a heat map, yearly totals, change against the year before and monthly averages. The selected year runs month by month next to last year with a running total and goal pace. Income is also split by account, sector and payment type (regular, special, interest and more).
Allocation and Rebalance
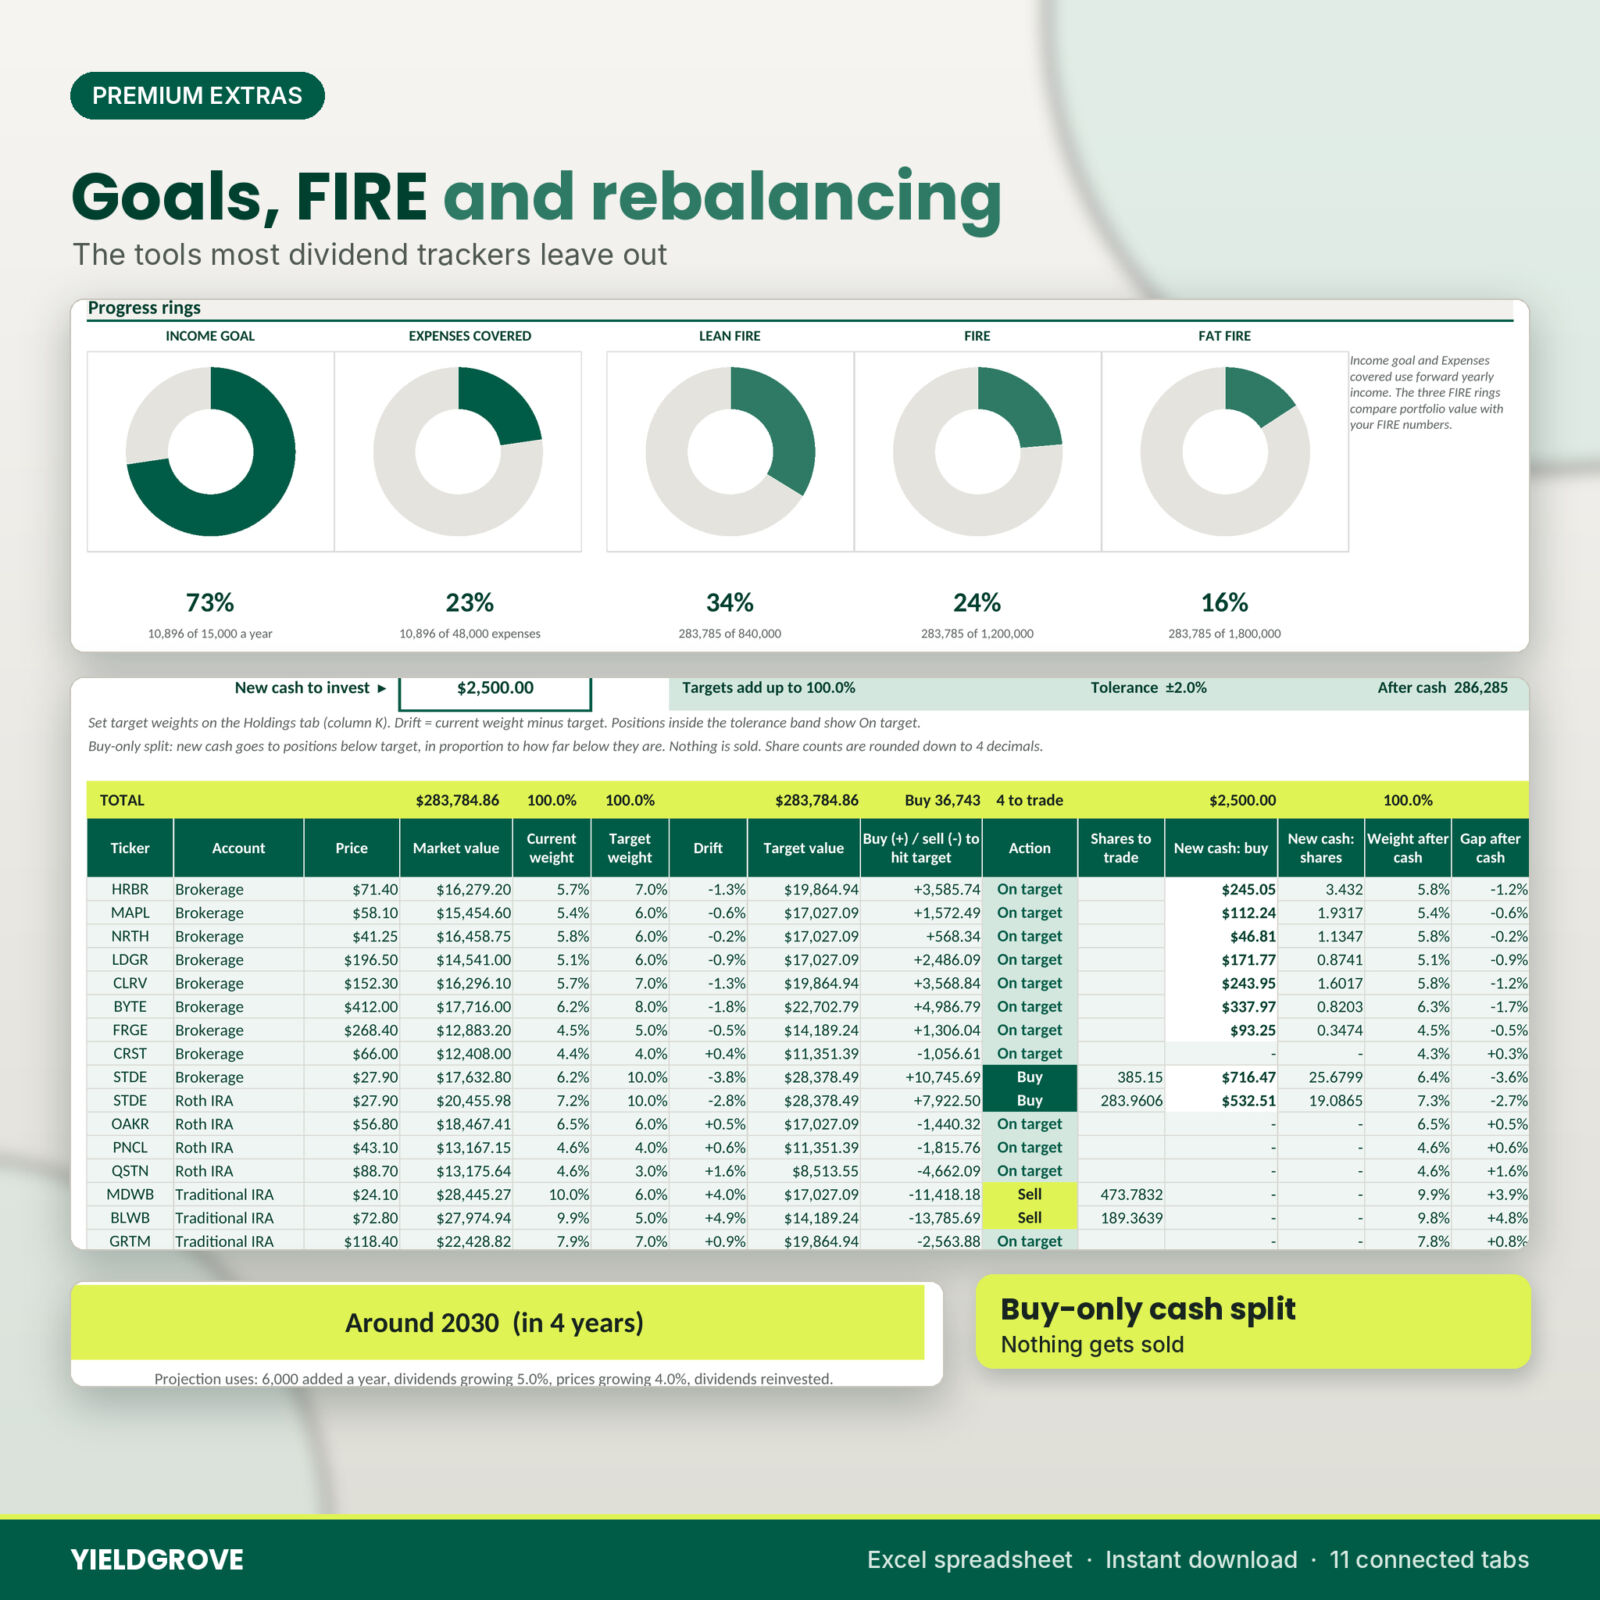
Value, cost, income and yield by sector, account and asset type, with doughnut charts and a concentration check that flags any position above your chosen weight. Set target weights and the Rebalance tab shows drift, the amount to buy or sell and the shares to trade. Adding new money? Type the amount and it is split across positions that are below target, without selling anything.
Goal and FIRE tracker
Set a yearly income goal and your yearly expenses. Five progress rings show income goal, expenses covered, Lean FIRE, FIRE and Fat FIRE. A 25-year income projection uses your own rates for new money, dividend growth and price growth, and tells you roughly when income could meet your goal.
Position Card
Pick any position to see its numbers on one page: shares, average cost, value, gain, income, yields, total return, dividends by year with a chart, and the 12 latest dividends and trades.
What is included
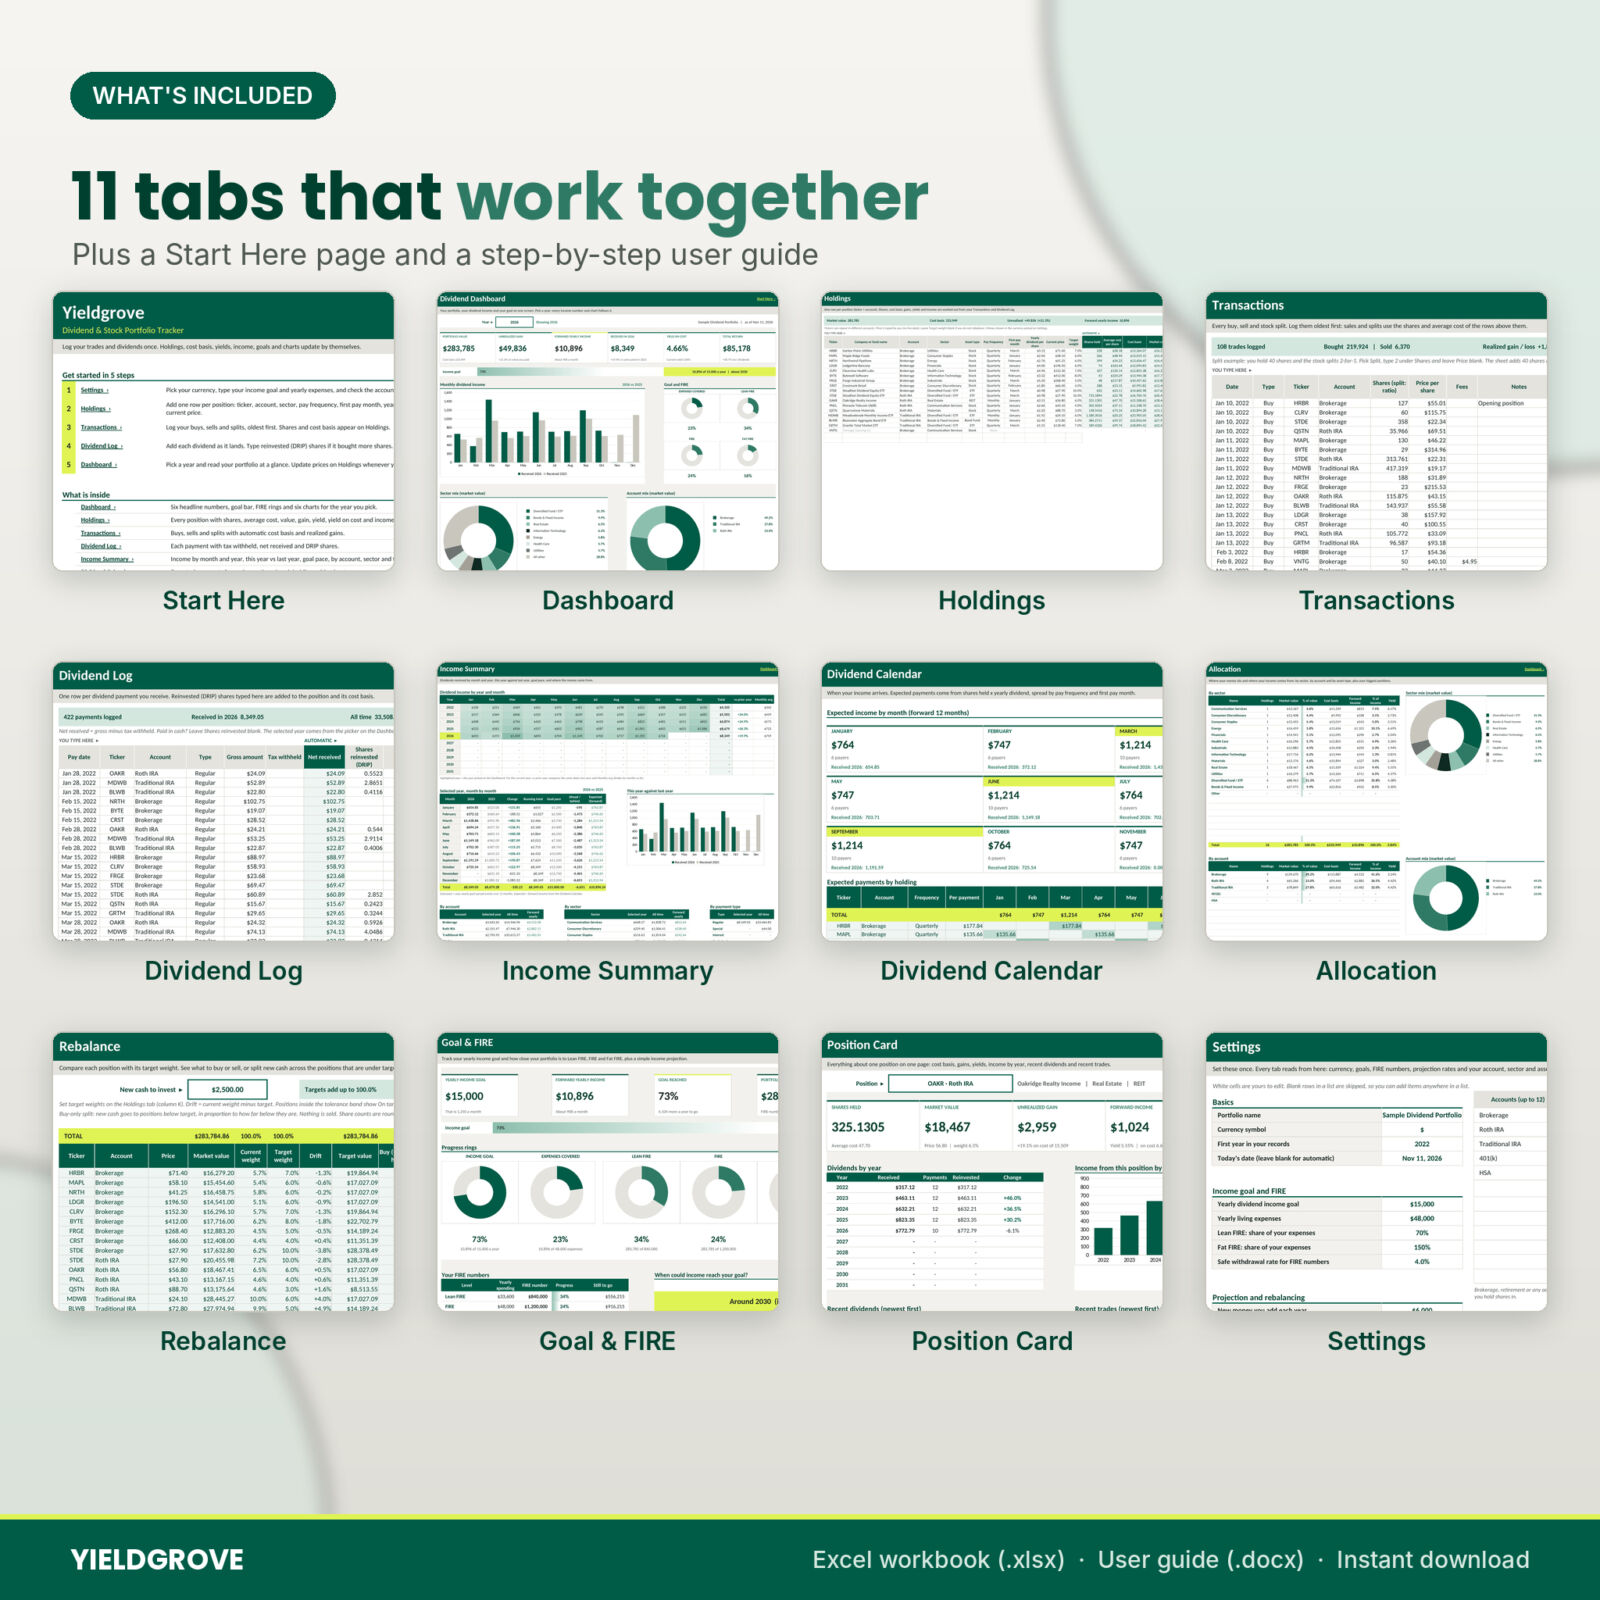
- Yieldgrove-Dividend-Portfolio-Tracker.xlsx: the Excel workbook with Start Here, Dashboard, Holdings, Transactions, Dividend Log, Income Summary, Dividend Calendar, Allocation, Rebalance, Goal & FIRE, Position Card and Settings
- Yieldgrove-User-Guide.docx: a 27-page step-by-step guide with screenshots, troubleshooting and FAQs
Room for 100 positions, 2,000 trades and 3,000 dividend payments.
How it works
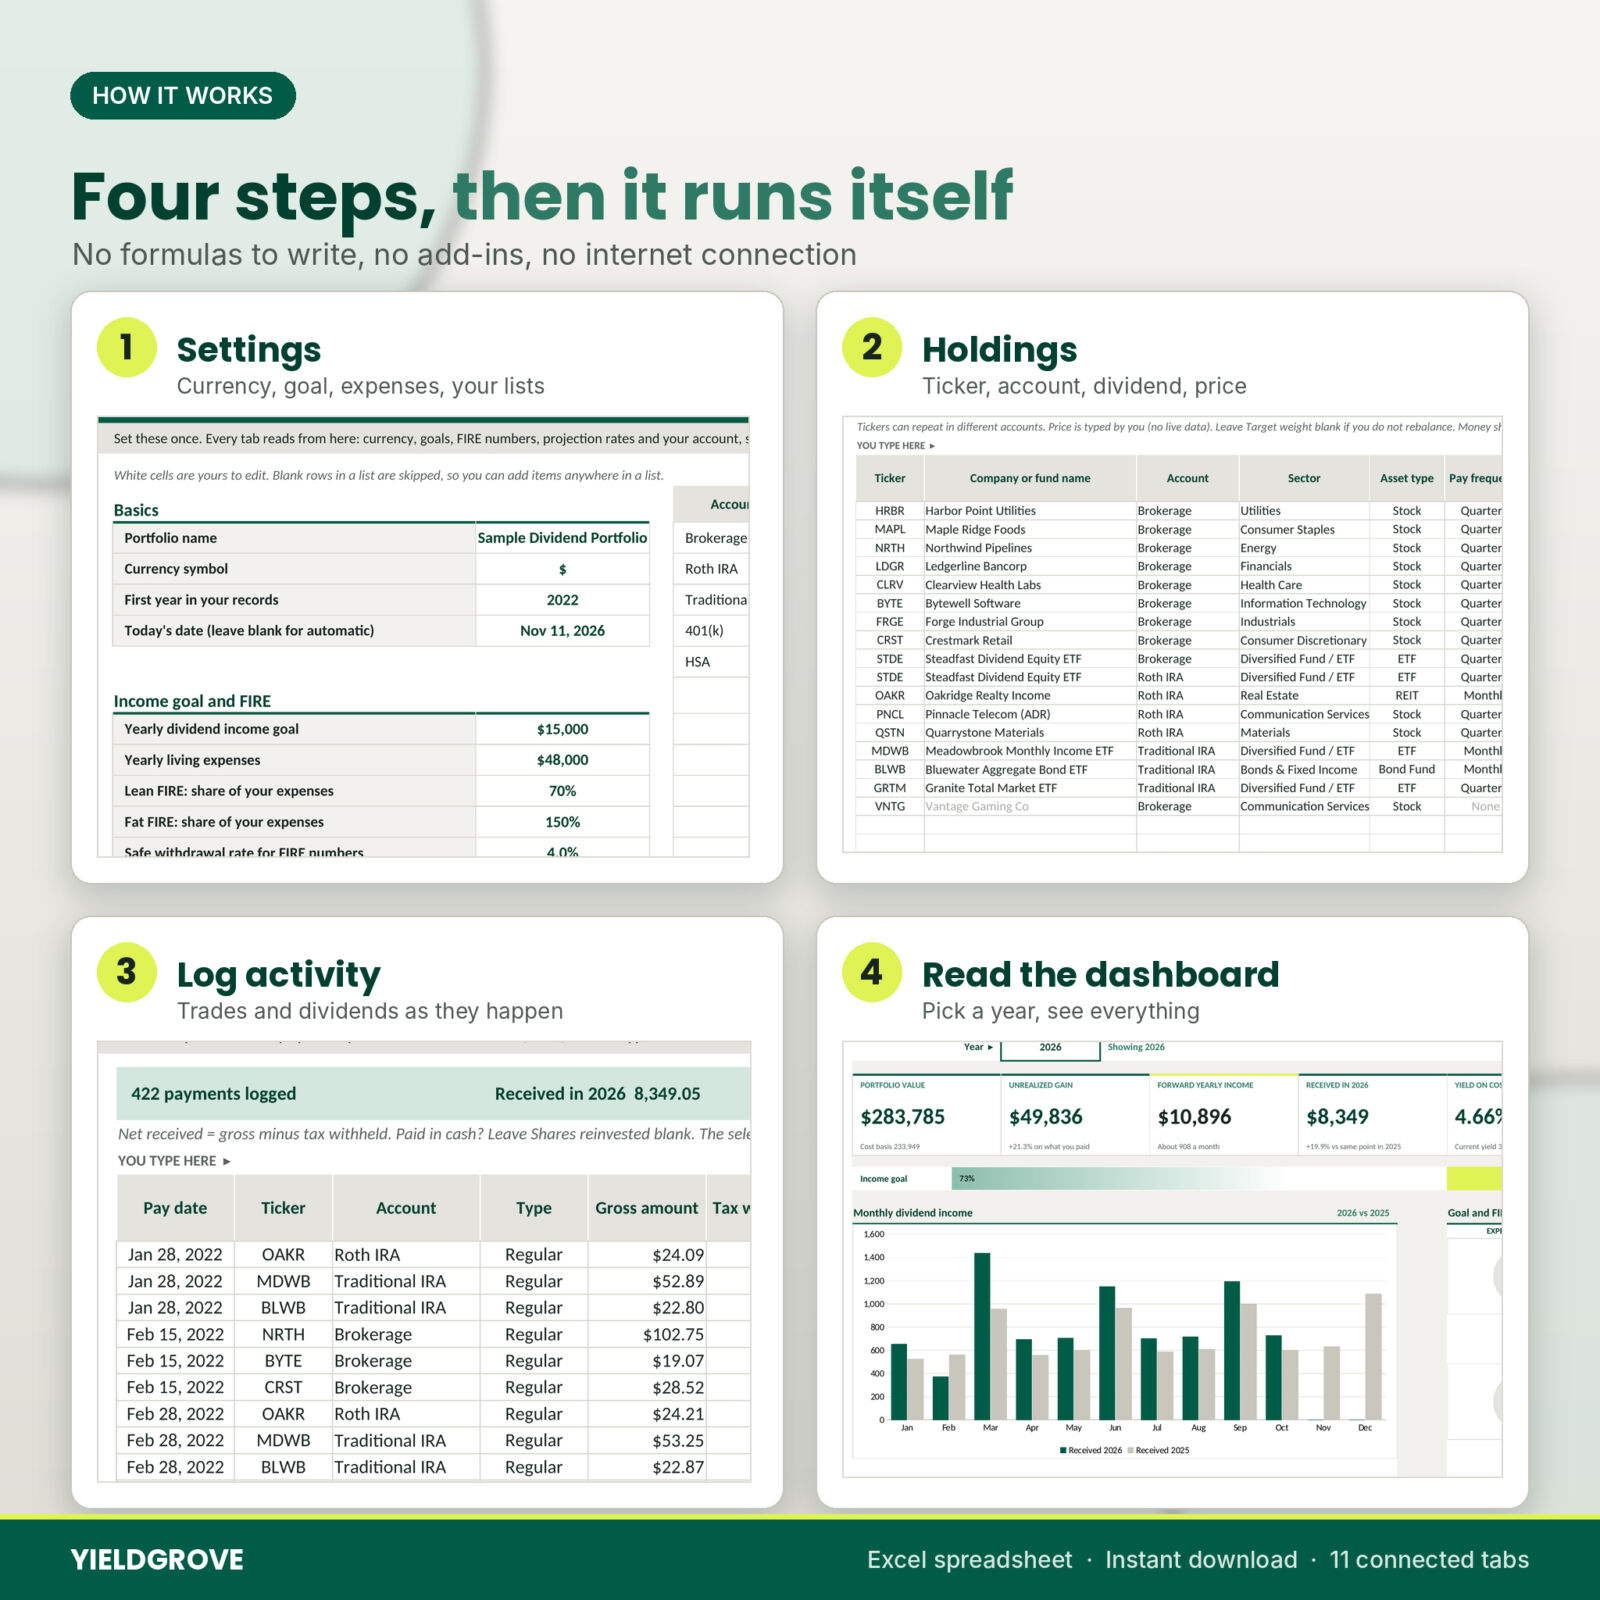
- On Settings, pick your currency, type your income goal and expenses, and check your account and sector lists.
- On Holdings, add one row per position: ticker, account, sector, pay frequency, first pay month, yearly dividend per share and current price.
- Log trades on Transactions and dividends on the Dividend Log as they happen.
- Open the Dashboard and pick a year.
Grey headers mark the columns you type. Green headers are automatic and locked, so a stray keystroke cannot break a formula.
Who it is for
- Dividend growth investors who want to watch monthly income build up
- Anyone with a brokerage account plus a Roth IRA, Traditional IRA, 401(k) or HSA
- FIRE savers who want a clear number and a rough date to aim for
- Investors who prefer a private file to linking a broker to an app
Real ways to use it
- Sunday check-in: update prices, log the week’s dividends and see if this month beats last year.
- Monthly contribution: type your new cash on Rebalance to see which positions are under target and how many shares to buy.
- After a 3-for-1 split: log one Split row and your share count and average cost update.
File format and software
One .xlsx workbook and one .docx guide. Built for Microsoft Excel 2010 or newer on Windows or Mac, and tested in LibreOffice Calc. It is not built for Google Sheets or Apple Numbers. No macros, no add-ins and no internet connection needed. Prices are typed by you: the file does not pull live quotes or link to a broker.
Customization
Pick from 24 currency symbols and every money cell switches. Rename accounts, sectors and asset types, change your goal, expenses, safe withdrawal rate, projection rates, rebalance tolerance and concentration alert. Sheets are protected without a password, so you can unprotect them to change the design.
Digital download
This is a digital product. No physical item is shipped. Your files are ready to download right after purchase. Personal use license: use it for your own portfolio, but please do not resell or share the files. Yieldgrove is a record keeping tool and not investment, tax or financial advice. Sample tickers in the images are made up.
FAQ
Does this dividend tracker pull live stock prices?
No. You type prices yourself, which keeps your data private and the file working offline.
Does it work with Google Sheets?
It is built for Excel 2010 or newer and tested in LibreOffice Calc. Google Sheets is not supported.
Can I track several accounts?
Yes. Add up to 12 accounts. The same ticker can be held in more than one account as separate rows.
How is cost basis calculated?
With the average cost method. Sales remove shares at your average cost, and reinvested dividends add to cost.
Can I track reinvested dividends and stock splits?
Yes. Type DRIP shares on the Dividend Log and log splits as a ratio on Transactions.
Does it track ETFs, REITs and funds?
Yes. Any holding with a price and a dividend works.
Can I use my own currency?
Yes. Pick your symbol on Settings and every money cell updates. The workbook does not convert between currencies.
Reviews
There are no reviews yet.