Looking for a free printable blood pressure log you can use today? Below you can download our Pulsepage Lite log sheet as a fillable PDF. Print it and keep it next to your monitor, or type straight into it on your computer. Then read on for a simple routine that makes your home readings accurate and useful to your doctor.
Pulsepage Lite: Free Printable Blood Pressure Log (Fillable PDF)
Get the free weekly blood pressure log sheet with the adult category chart. Type into it on screen or print it at home.
Want everything unlocked?
The free file is a sample. The full version has every page, tab and feature, plus the user guide.
See the full versionThe download is free. Just enter your email address in the box above and the PDF is sent your way. Free downloads are limited to 3 per day.
What’s in the Free Blood Pressure Log Printable
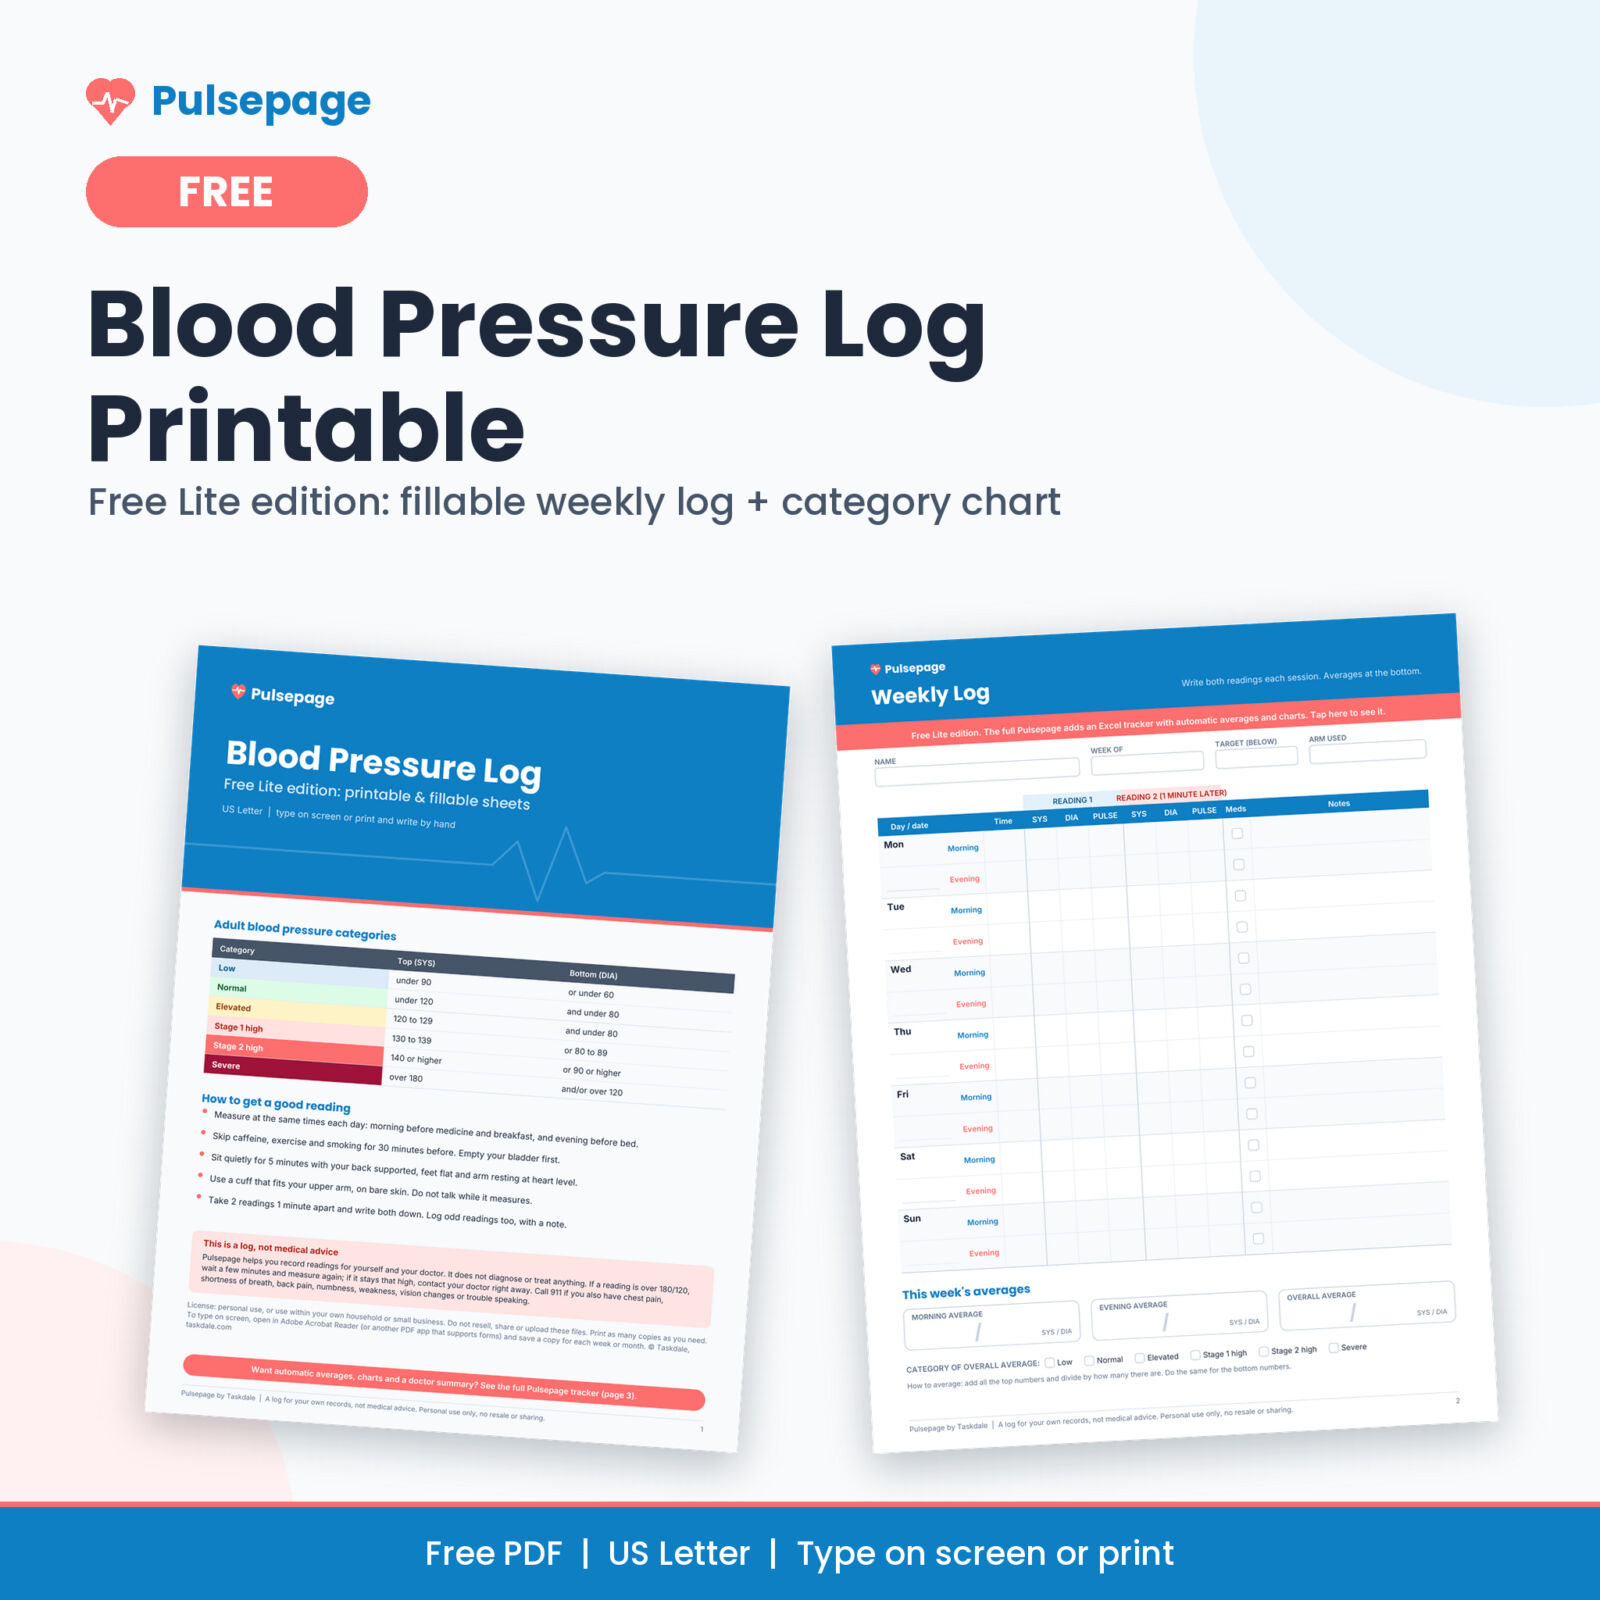
The Lite edition is a 3-page US Letter PDF. Every field can be filled on screen, and every page prints cleanly in black and white or color.
- Reference page: the adult blood pressure categories in a color chart, plus 5 steps for an accurate reading.
- Weekly log: 7 days with a morning and an evening row. Each row has space for the time, 2 readings (systolic, diastolic, pulse), a medication check box and notes.
- Weekly averages: boxes for your morning, evening and overall averages, and check boxes to mark the category.
- Upgrade page: a look at the full Pulsepage tracker if you want the averages done for you.
Print one copy per week, or open the PDF in Adobe Acrobat Reader, type your readings and use Save As to keep a copy for each week.
Why Keep a Blood Pressure Log at Home?
A single reading at the doctor’s office is a snapshot. Blood pressure moves all day. It rises with stress, coffee, pain and a full bladder, and some people read higher just because they’re in a clinic. Home readings taken the same way, at the same times, give a far better picture.
That’s why many doctors ask patients to log their numbers for a week or two before a visit, after starting a new medicine, or on an ongoing basis. A written log helps you:
- See whether your numbers are trending up, down or holding steady
- Show your doctor real data instead of “it’s usually around 130”
- Notice links between readings and things like sleep, salt or stress
- Spot readings that need a quick call to your doctor
Blood Pressure Categories for Adults
Every reading has two numbers. The top number (systolic) is the pressure when your heart beats. The bottom number (diastolic) is the pressure between beats. The standard adult categories used by the American Heart Association are:
- Normal: under 120 and under 80
- Elevated: 120 to 129 and under 80
- Stage 1 high blood pressure: 130 to 139 or 80 to 89
- Stage 2 high blood pressure: 140 or higher, or 90 or higher
- Severe: over 180 and/or over 120
The higher category wins. A reading of 118/84 counts as Stage 1 because the bottom number is in the Stage 1 range. If a reading is over 180/120, wait a few minutes and measure again. If it stays that high, contact your doctor right away, and call 911 if you also have chest pain, shortness of breath, back pain, numbness, weakness, vision changes or trouble speaking.
These ranges are general. Your doctor may give you a different personal target, so write that target at the top of your log.
How to Take an Accurate Reading at Home
Small details change your numbers by 5 to 10 points or more. Follow the same routine every time:
- Pick your times. Measure in the morning before medicine, food and coffee, and again in the evening before bed.
- Prepare. Skip caffeine, exercise and smoking for 30 minutes before. Use the bathroom first.
- Sit right. Back supported, feet flat on the floor, legs uncrossed, arm resting on a table at heart level.
- Use the right cuff. It should fit your upper arm and sit on bare skin, not over a sleeve.
- Rest and stay quiet. Sit still for 5 minutes, then measure without talking.
- Take 2 readings. Wait about 1 minute and measure again. Write both down.
Log every reading, even the odd ones. A high number with a note like “argument just before” is useful information. A gap where you skipped the high one is not.

Pulsepage Blood Pressure Log & Tracker
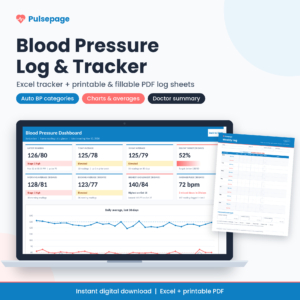
Type your readings and let Excel work out the categories, averages and charts.
- Dashboard with 7 and 30 day averages and 4 charts
- Weekly and monthly averages filled in automatically
- One-page Doctor Summary to print
How to Fill In Your Weekly Blood Pressure Log
Here’s how to use the free weekly sheet from start to finish:
- Write your name, the week’s start date, your target and which arm you use at the top.
- Each morning, fill in the Morning row for that day: time, reading 1 (SYS, DIA, PULSE) and reading 2.
- Tick the Meds box once you’ve taken your medicine, and add a short note if anything was unusual.
- Repeat in the Evening row.
- At the end of the week, work out your averages and write them in the boxes at the bottom.
How to work out your average
Add up all the top numbers for the period and divide by how many readings there are. Then do the same for the bottom numbers. For example, morning readings of 132, 128, 130 and 126 add up to 516. Divided by 4, your morning systolic average is 129. Do this separately for morning and evening, because many people run a few points higher in the morning.
Then check your overall average against the category chart and tick the matching box. Over several weeks, your averages tell you far more than any single day.
What to Bring to Your Doctor
Doctors are busy, and a stack of loose numbers is hard to read in a 15-minute visit. Bring:
- Your averages for the last 2 to 4 weeks, split into morning and evening
- Your highest and lowest readings, with dates
- A list of your medicines and any missed doses
- Symptoms you noticed, such as headaches or dizziness when standing
- Your questions, written down before you go
- Your monitor, once a year, so the clinic can check it against theirs
It also helps to compare the clinic’s reading with your home average from the week before. If the clinic number is regularly 10 points or more above your home numbers, mention it. Doctors call this the white coat effect, and it can change treatment decisions.
Paper Log or Spreadsheet?
A paper log is quick and simple. You write the numbers next to the monitor and you’re done. The downside is the math. Working out weekly and monthly averages by hand, spotting your morning pattern and pulling a summary together before every appointment takes time, and it’s easy to slip.
A spreadsheet handles that part. You type each reading once, and the averages, categories and charts update by themselves. Many people use both: paper during the week, then a few minutes on Sunday typing the numbers in.
What the Full Pulsepage Tracker Adds
The free sheet covers one week on paper. The full Pulsepage download is built for tracking over months:
- Excel blood pressure tracker with automatic categories for every reading and room for 1,000 readings
- Dashboard with your latest reading, 7 and 30 day averages, morning vs evening, highest and lowest, and 4 charts
- Weekly and monthly averages filled in for you, plus a color-coded month calendar
- One-page Doctor Summary for any 7 to 90 days, ready to print
- Medication list and clinic visit log with a home vs clinic comparison
- Full printable set in US Letter and A4: weekly, monthly, 12-week averages, medications, doctor visit and clinic record pages
- User guide with screenshots and troubleshooting
It works in Microsoft Excel on Windows and Mac and opens in Google Sheets. See the full Pulsepage tracker here.
Get the Complete Pulsepage Tracker
The Excel tracker plus the full 7-page printable set in US Letter and A4.
- Color-coded month view of your readings
- Medication list and missed dose count
- Clinic vs home white coat check
Frequently Asked Questions
Is this blood pressure log really free?
Yes. The Lite PDF is free for personal use. You only need to enter your email address to get the download, and there’s a limit of 3 free downloads per day.
Can I fill in the PDF on my computer?
Yes. Open it in Adobe Acrobat Reader (free) or another PDF app that supports forms, click a field and type. Some web browser viewers display the form but don’t save what you type, so use Save As in a PDF app.
How often should I check my blood pressure at home?
Follow your doctor’s advice. A common routine is 2 readings in the morning and 2 in the evening for a week before an appointment, or after a change in medicine.
Which arm should I use?
Use the same arm every time. Some doctors ask you to check both arms once and then use the one with the higher reading. Write the arm at the top of your log.
Can I share the free log with friends?
Please send them to this page instead of sharing the file. The download is for your own personal use.
What does the full version add?
The full Pulsepage adds an Excel tracker that sorts readings into categories, calculates weekly and monthly averages, draws 4 charts, builds a one-page Doctor Summary and tracks medications and clinic visits, plus the complete printable set in US Letter and A4. See everything in the full version.
Pulsepage is a log for your own records. It is not medical advice and does not replace your doctor.