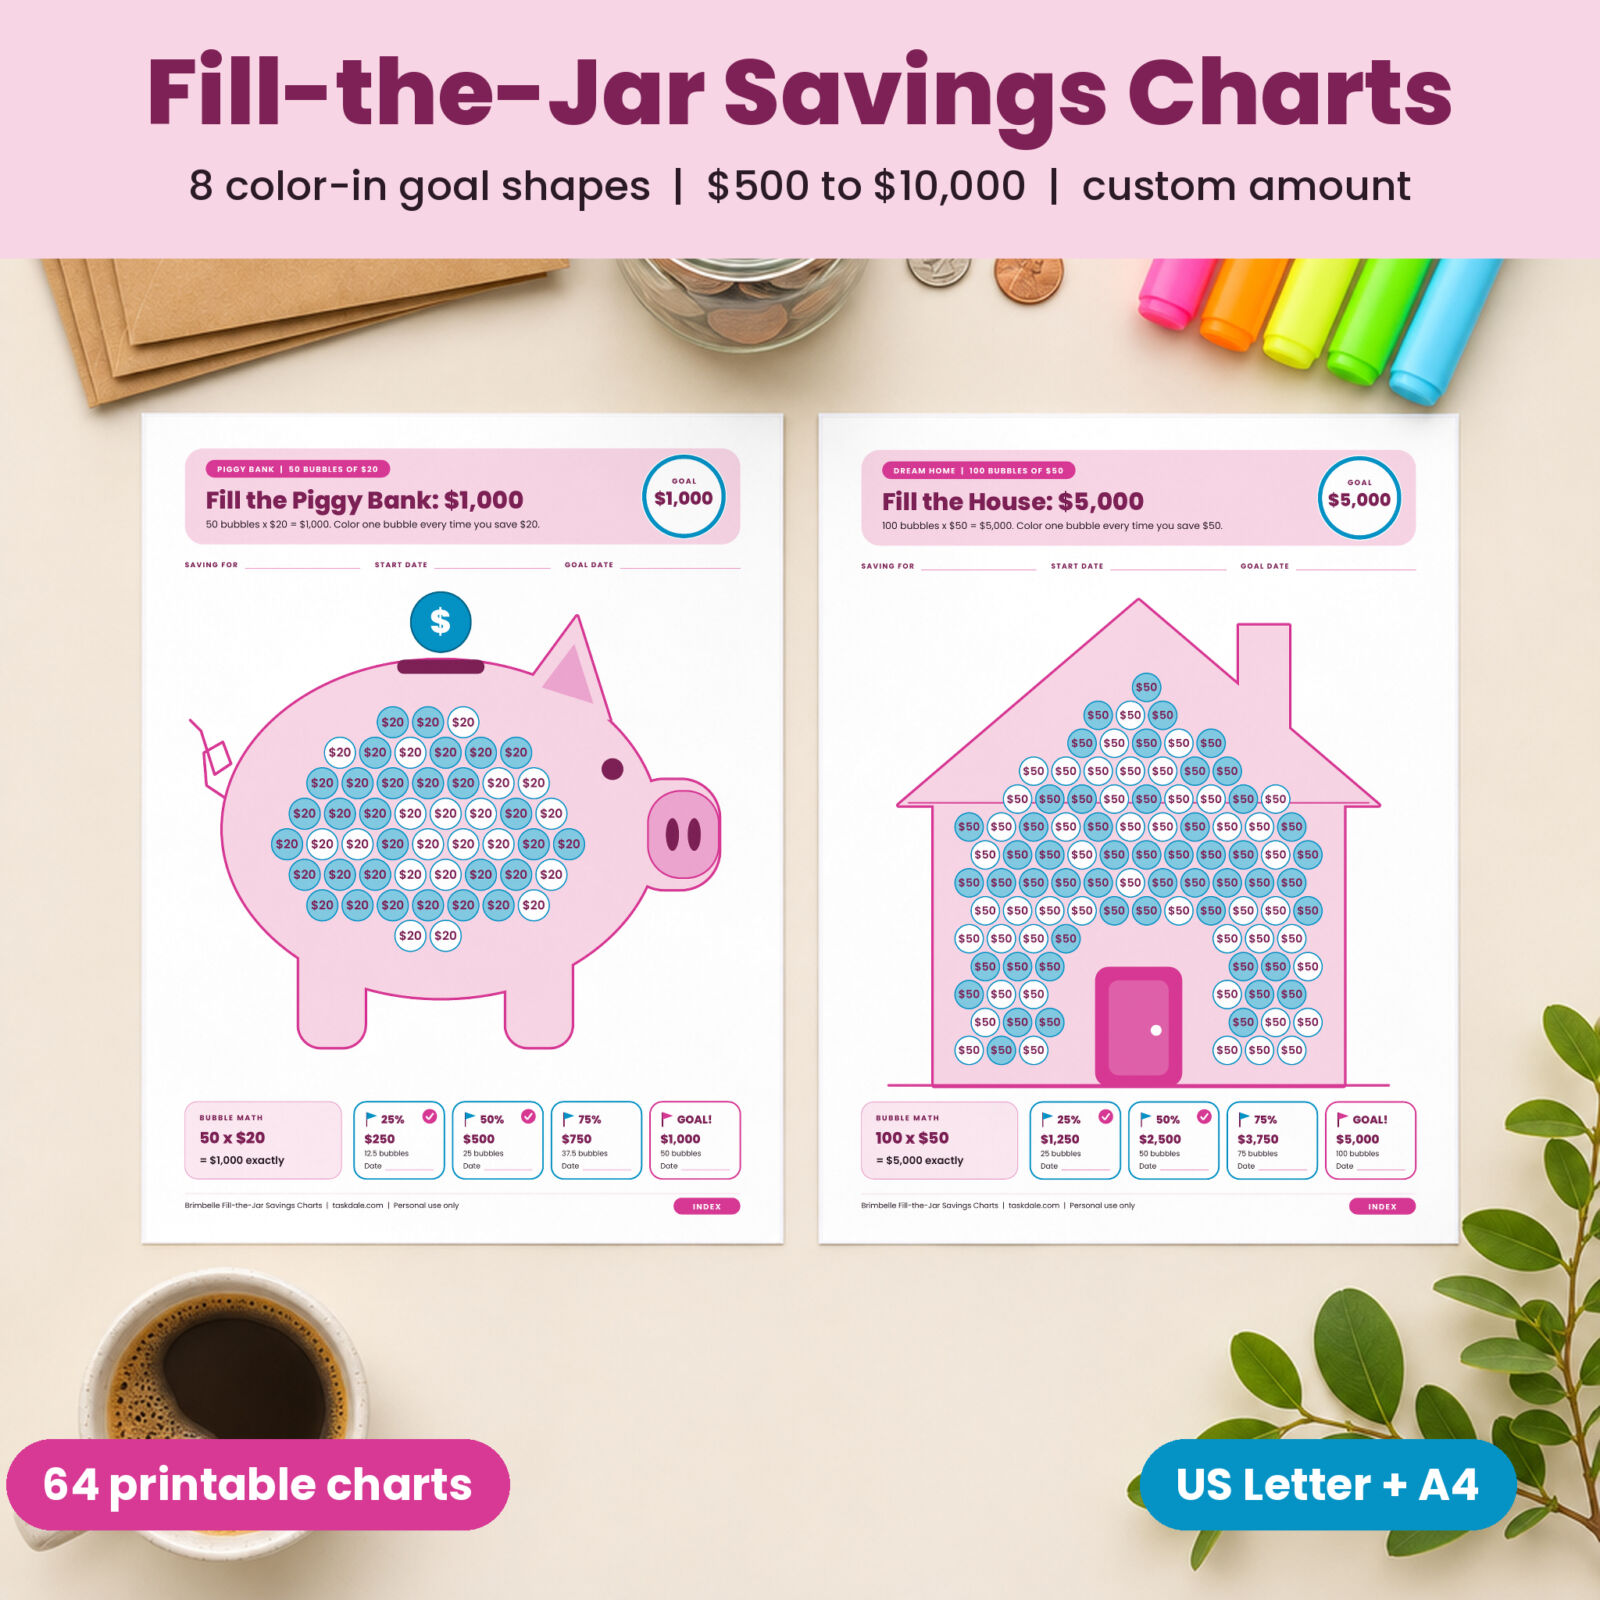


The Brimbelle fill the jar savings tracker is a printable set of color-in savings charts for real goals. Pick the shape that matches what you are saving for, print it, and color one bubble every time you put money aside. When the shape is full, you hit your goal.
Inside are 64 charts in 8 goal shapes. Each shape comes in six ready-made targets from $500 to $10,000, plus blank 50-bubble and 100-bubble versions for any amount you choose. Every bubble on a chart has the same even value, and every chart was checked so the bubbles add up to the goal with no rounding.
Why a fill the jar savings tracker works
Saving is slow and invisible. Your balance goes up by small amounts, and an app number rarely feels like progress. A chart on the fridge is different. You see it every morning, you see the colored bubbles stacking up, and you want to color the next one. That small reward is often enough to move one more transfer into savings.
Brimbelle adds structure to that habit. Each chart prints the bubble math, splits the goal into 25%, 50% and 75% milestones, and gives you a place to write the date you reach each one.
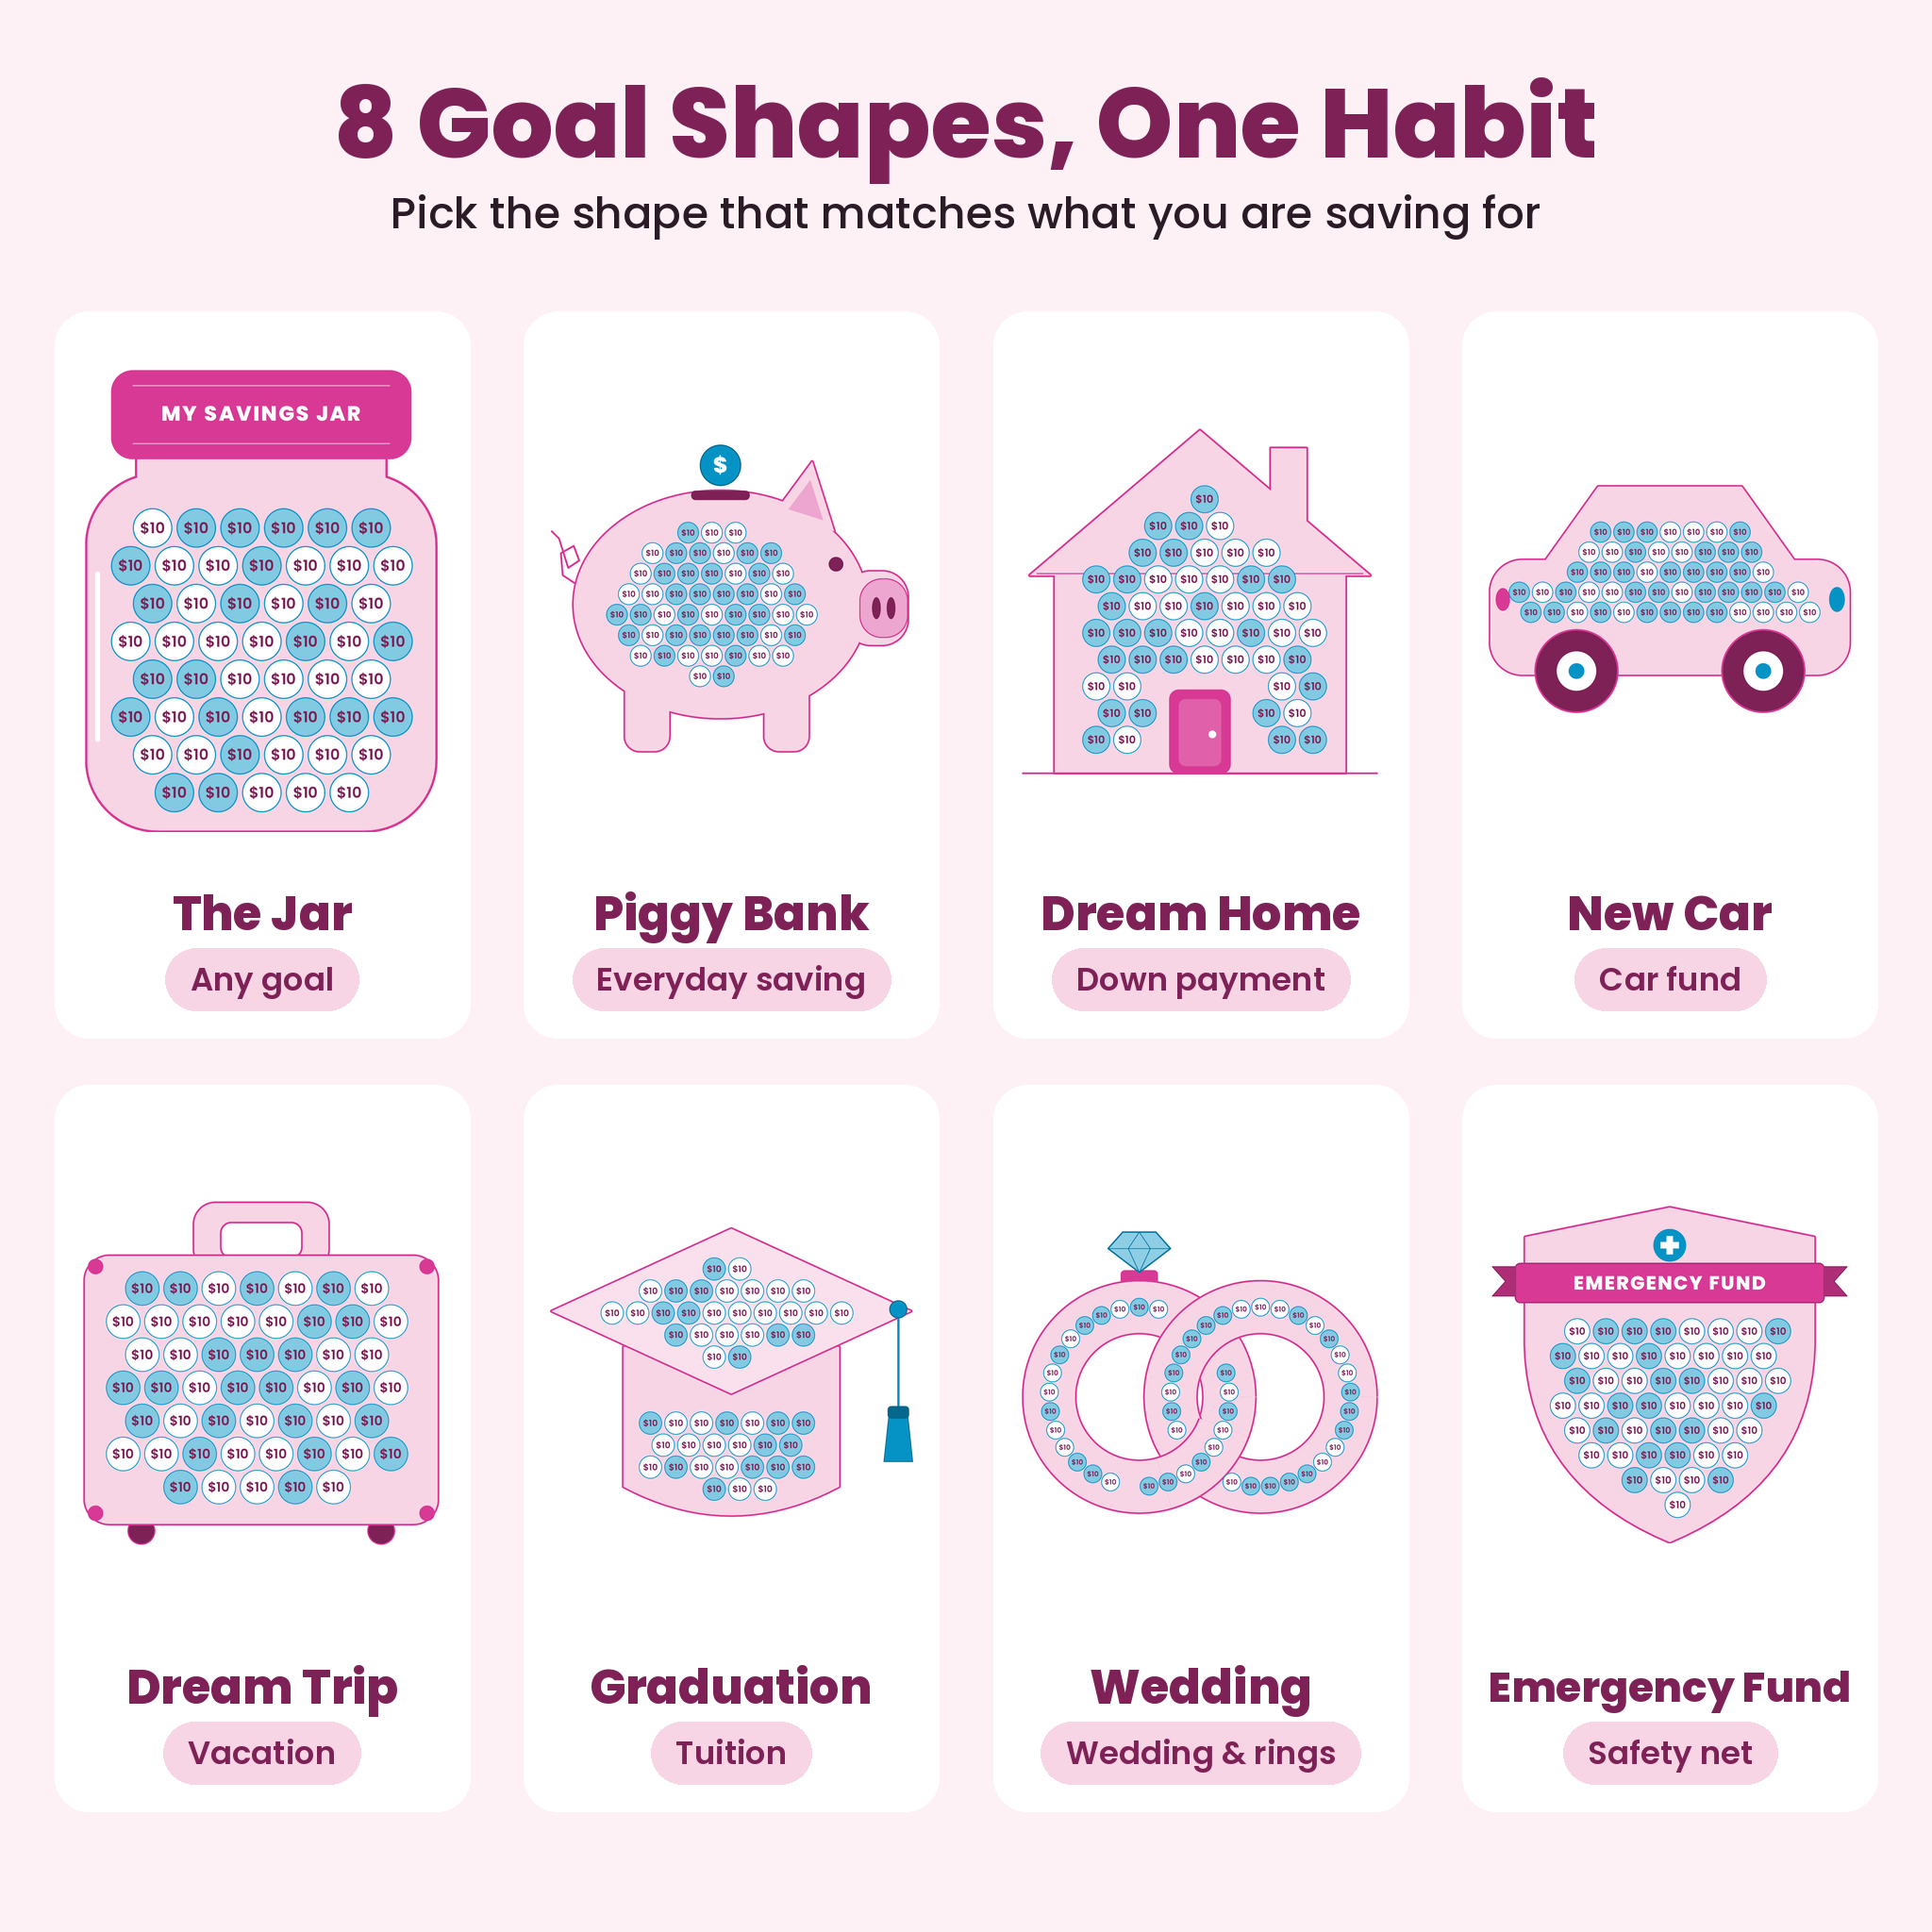
8 goal shapes
- The Jar: the classic fill the jar chart for any goal.
- Piggy Bank: everyday saving for kids and grown-ups.
- Dream Home: a down payment, closing costs, a move or a renovation.
- New Car: a car down payment, a cash car or repairs.
- Dream Trip: a suitcase for flights, hotels and vacations.
- Graduation: a cap for tuition, books or a college fund.
- Wedding: two rings for a wedding, an engagement ring or a honeymoon.
- Emergency Fund: a shield for the safety net every household needs.
Six targets with bubble math that adds up
| Goal | Bubbles | Each bubble |
|---|---|---|
| $500 | 50 | $10 |
| $1,000 | 50 | $20 |
| $2,000 | 100 | $20 |
| $2,500 | 50 | $50 |
| $5,000 | 100 | $50 |
| $10,000 | 100 | $100 |
Saving for a different amount? The 16 custom charts have blank bubbles, and the custom amount helper lists 17 goals from $300 to $20,000 with the value per bubble already worked out.
What is included
- 2 printable PDF files, US Letter (8.5 x 11 in) and A4, 72 pages each
- 48 ready-made color-in savings charts (8 shapes x 6 targets)
- 16 custom charts with 50 or 100 blank bubbles, one pair for every shape
- A clickable chart index, with an INDEX button on every chart to jump back
- Goal pace planner showing the monthly and weekly amount for 3, 6, 12, 18 and 24 months
- Custom amount helper table
- Savings log for dates, deposits, bubbles colored and running totals
- Goal reached certificate
- Welcome page with coloring tips, plus a DOCX user guide with FAQ and troubleshooting
How it works
- Open the PDF and tap your shape and amount on the index page.
- Print that page on plain paper or card stock.
- Write what you are saving for, your start date and your goal date.
- Each time you save one bubble amount, color a bubble. Any order works.
- Date each milestone flag, then print the certificate when the shape is full.
Who this savings chart printable is for
- First-time savers who want an easy, visual start with a $500 or $1,000 goal
- Couples saving for a wedding, a first home or a honeymoon
- Parents building a college fund, or kids saving gift and allowance money in the piggy bank
- Anyone building an emergency fund one paycheck at a time
- Savings challenge fans who want a goal shape instead of a plain grid
Real ways people use it
Post the $1,000 emergency fund shield on the fridge and color two $20 bubbles every payday. Hang the suitcase chart next to the calendar while you count down to a family trip. Give each child a $500 piggy bank chart and let them color a $10 bubble each time they save birthday money. Use the house chart at $10,000 for a down payment and pair it with the savings log so every deposit is on record.
File format and requirements
Printable PDF files with embedded fonts. Open them in Adobe Acrobat Reader, Preview, a web browser or any PDF app, then print at home or at a print shop. The index links work in most PDF readers. No special software is needed.
Currency and customizing
The ready-made charts show $, and the math works the same for any currency. Custom charts leave the amounts blank so you can write euros, pounds or any currency you use. Color with highlighters, colored pencils, gel pens or stickers.
Digital download
This is an instant digital download. No physical item is shipped. Your files are available right after checkout and in your Taskdale account.
FAQ
How does a fill the jar savings tracker work?
Each bubble is worth a set amount. When you save that amount, you color a bubble. When every bubble is colored, you have saved the full goal.
Do the bubbles really add up to the goal?
Yes. Every ready-made chart uses equal, even bubble values, for example 100 bubbles of $50 for $5,000. Each one was checked by calculation.
Can I use it for an amount that is not listed?
Yes. Use a 50-bubble or 100-bubble custom chart and divide your goal by the number of bubbles. The helper table does the math for 17 common goals.
What paper size should I choose?
US Letter for the US and Canada, A4 for most other countries. Both files are included.
Can I print it more than once?
Yes. Print as many copies as you need for your own household.
Is this good for kids?
Yes. The $500 piggy bank and jar charts have large bubbles that are easy to color, and they make a great first savings goal.
Can I use it on an iPad?
The PDFs open on tablets and the index links work in most PDF readers, but the charts are designed for printing. We have not tested them in note-taking apps.
License: personal use only. Please do not resell, share or distribute the files. All artwork is original and made by Taskdale.
Reviews
There are no reviews yet.