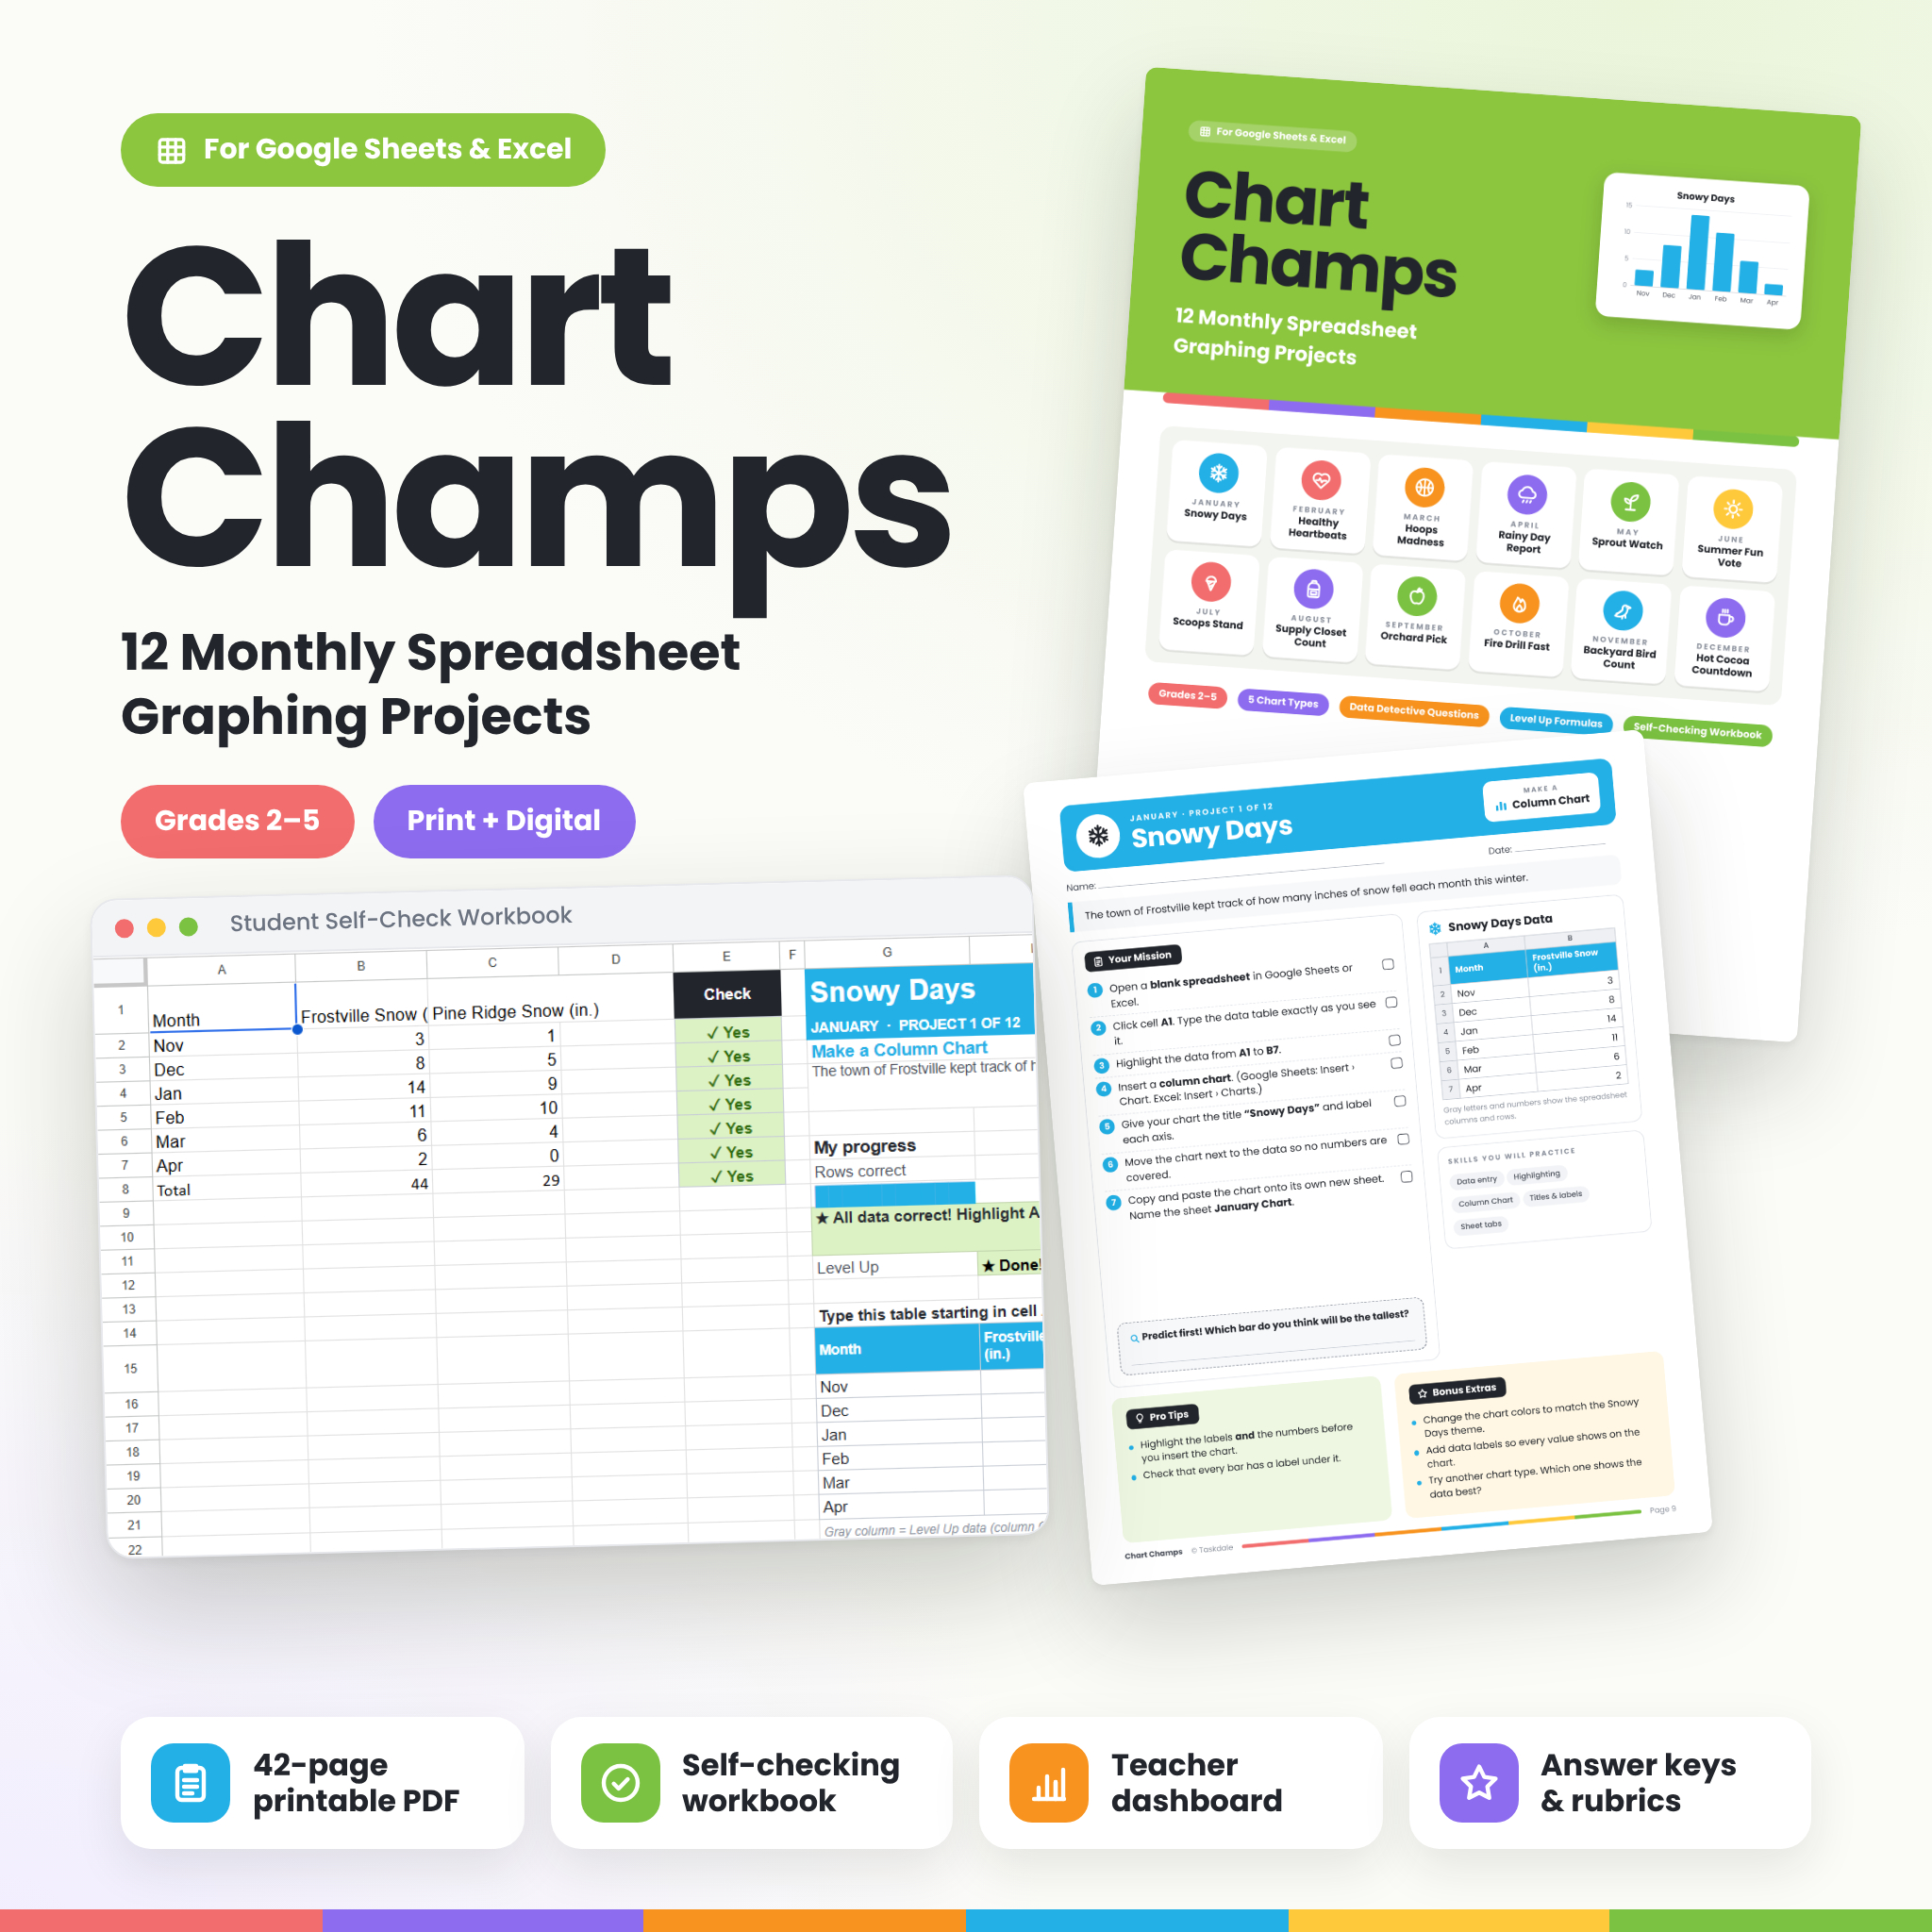


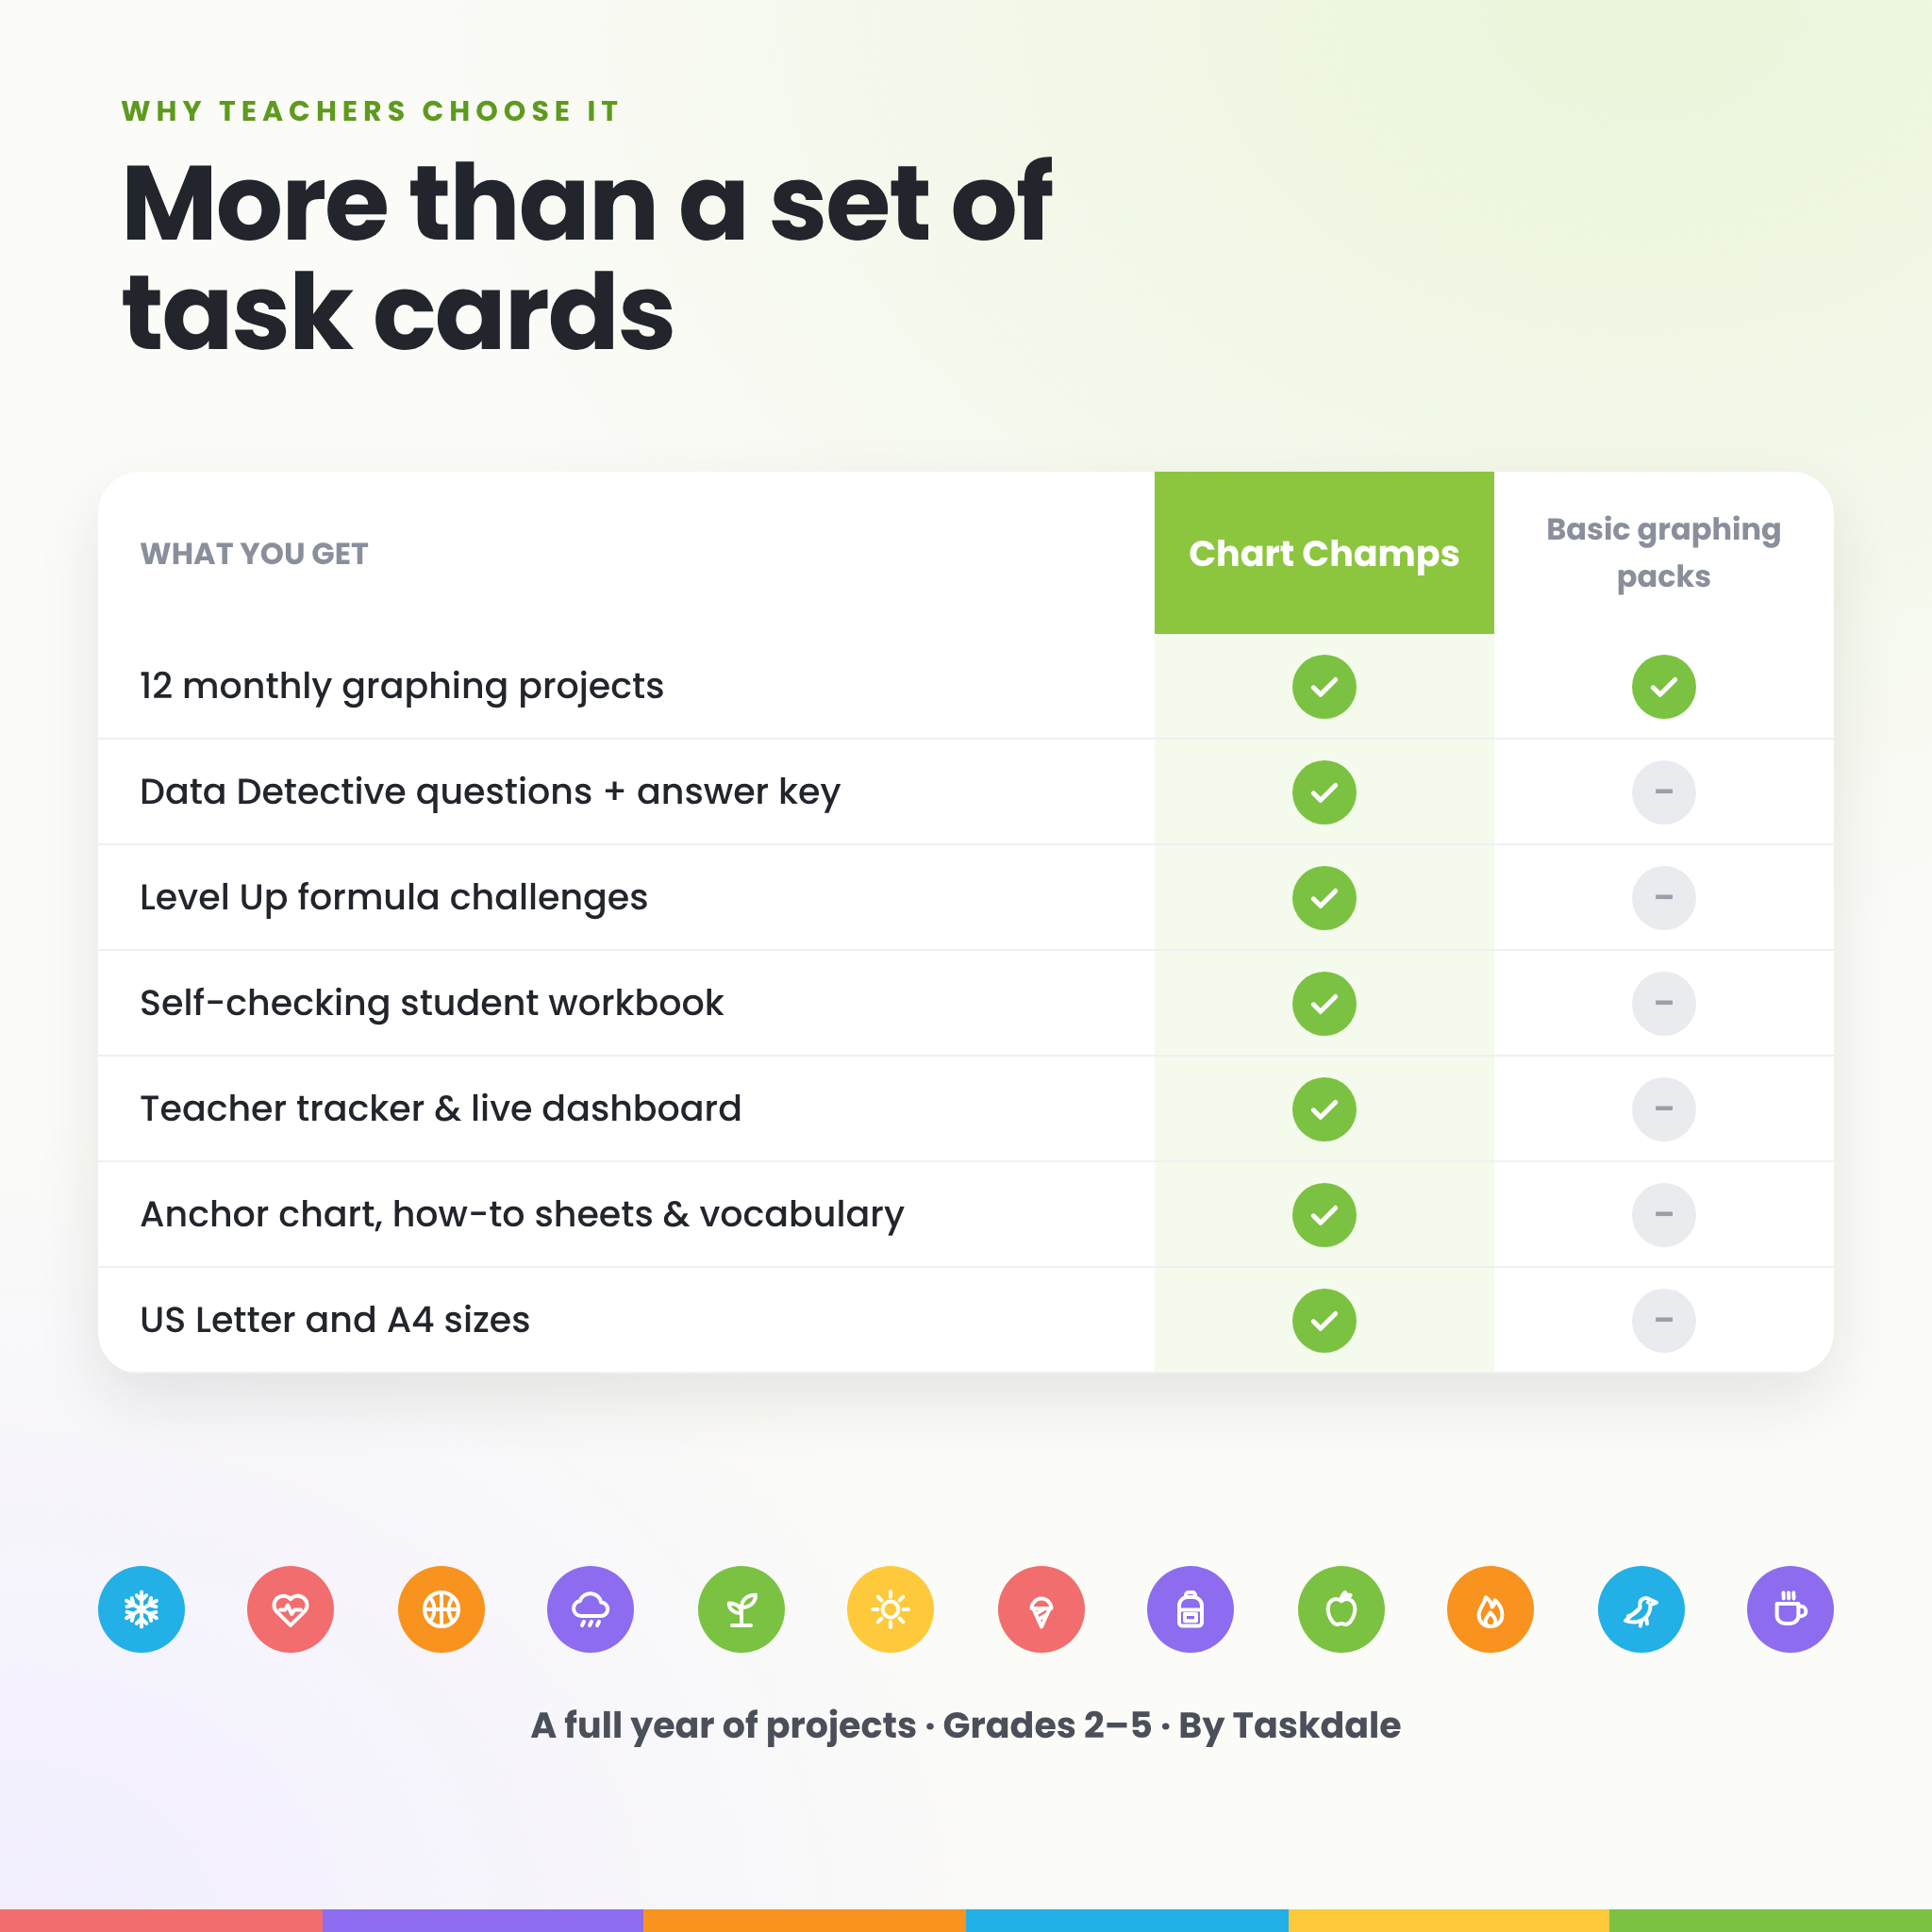
Chart Champs is a full year of Google Sheets graphing projects for grades 2–5 that also work in Excel. Every month, students type a fun, ready-made data set into a spreadsheet, build the right kind of chart, and then use their chart to answer real data questions. A self-checking student workbook tells them right away when their typing is correct, and a teacher toolkit tracks the whole class for you.
It is built for busy computer lab, technology and classroom teachers who want spreadsheet lessons that are easy to start, easy to grade and still meaningful for students who finish early.
What makes these Google Sheets graphing projects different
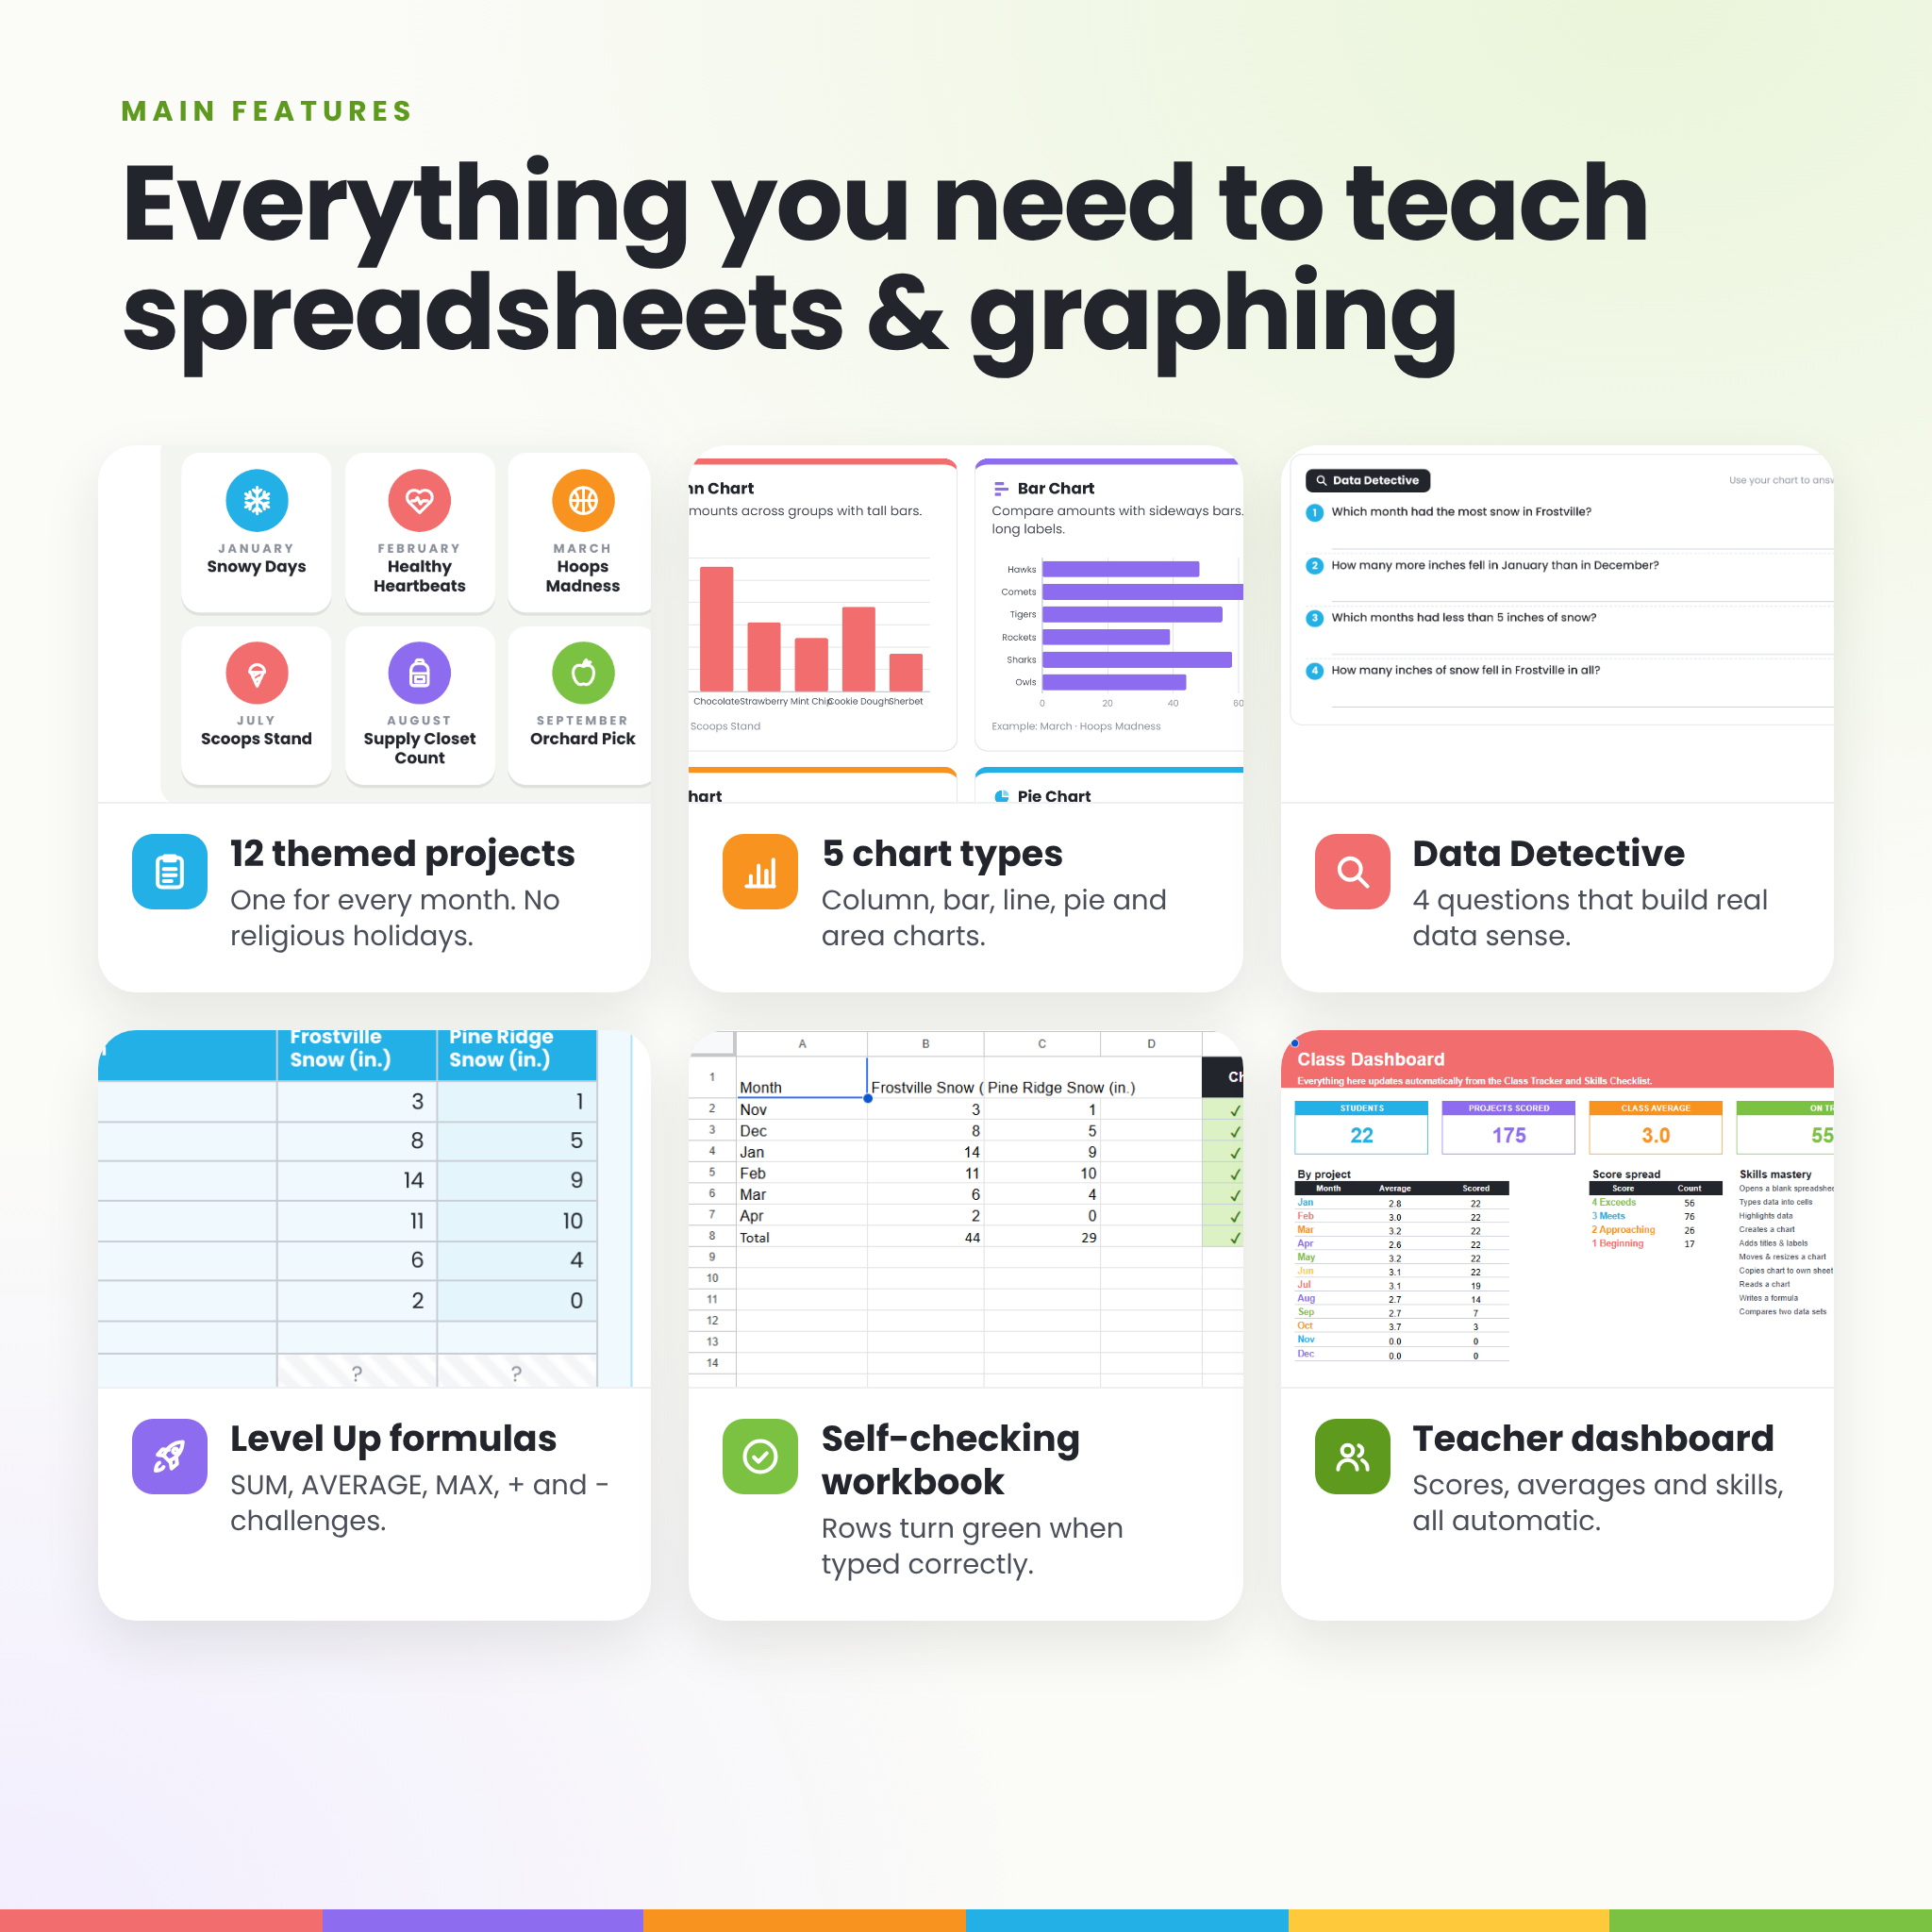
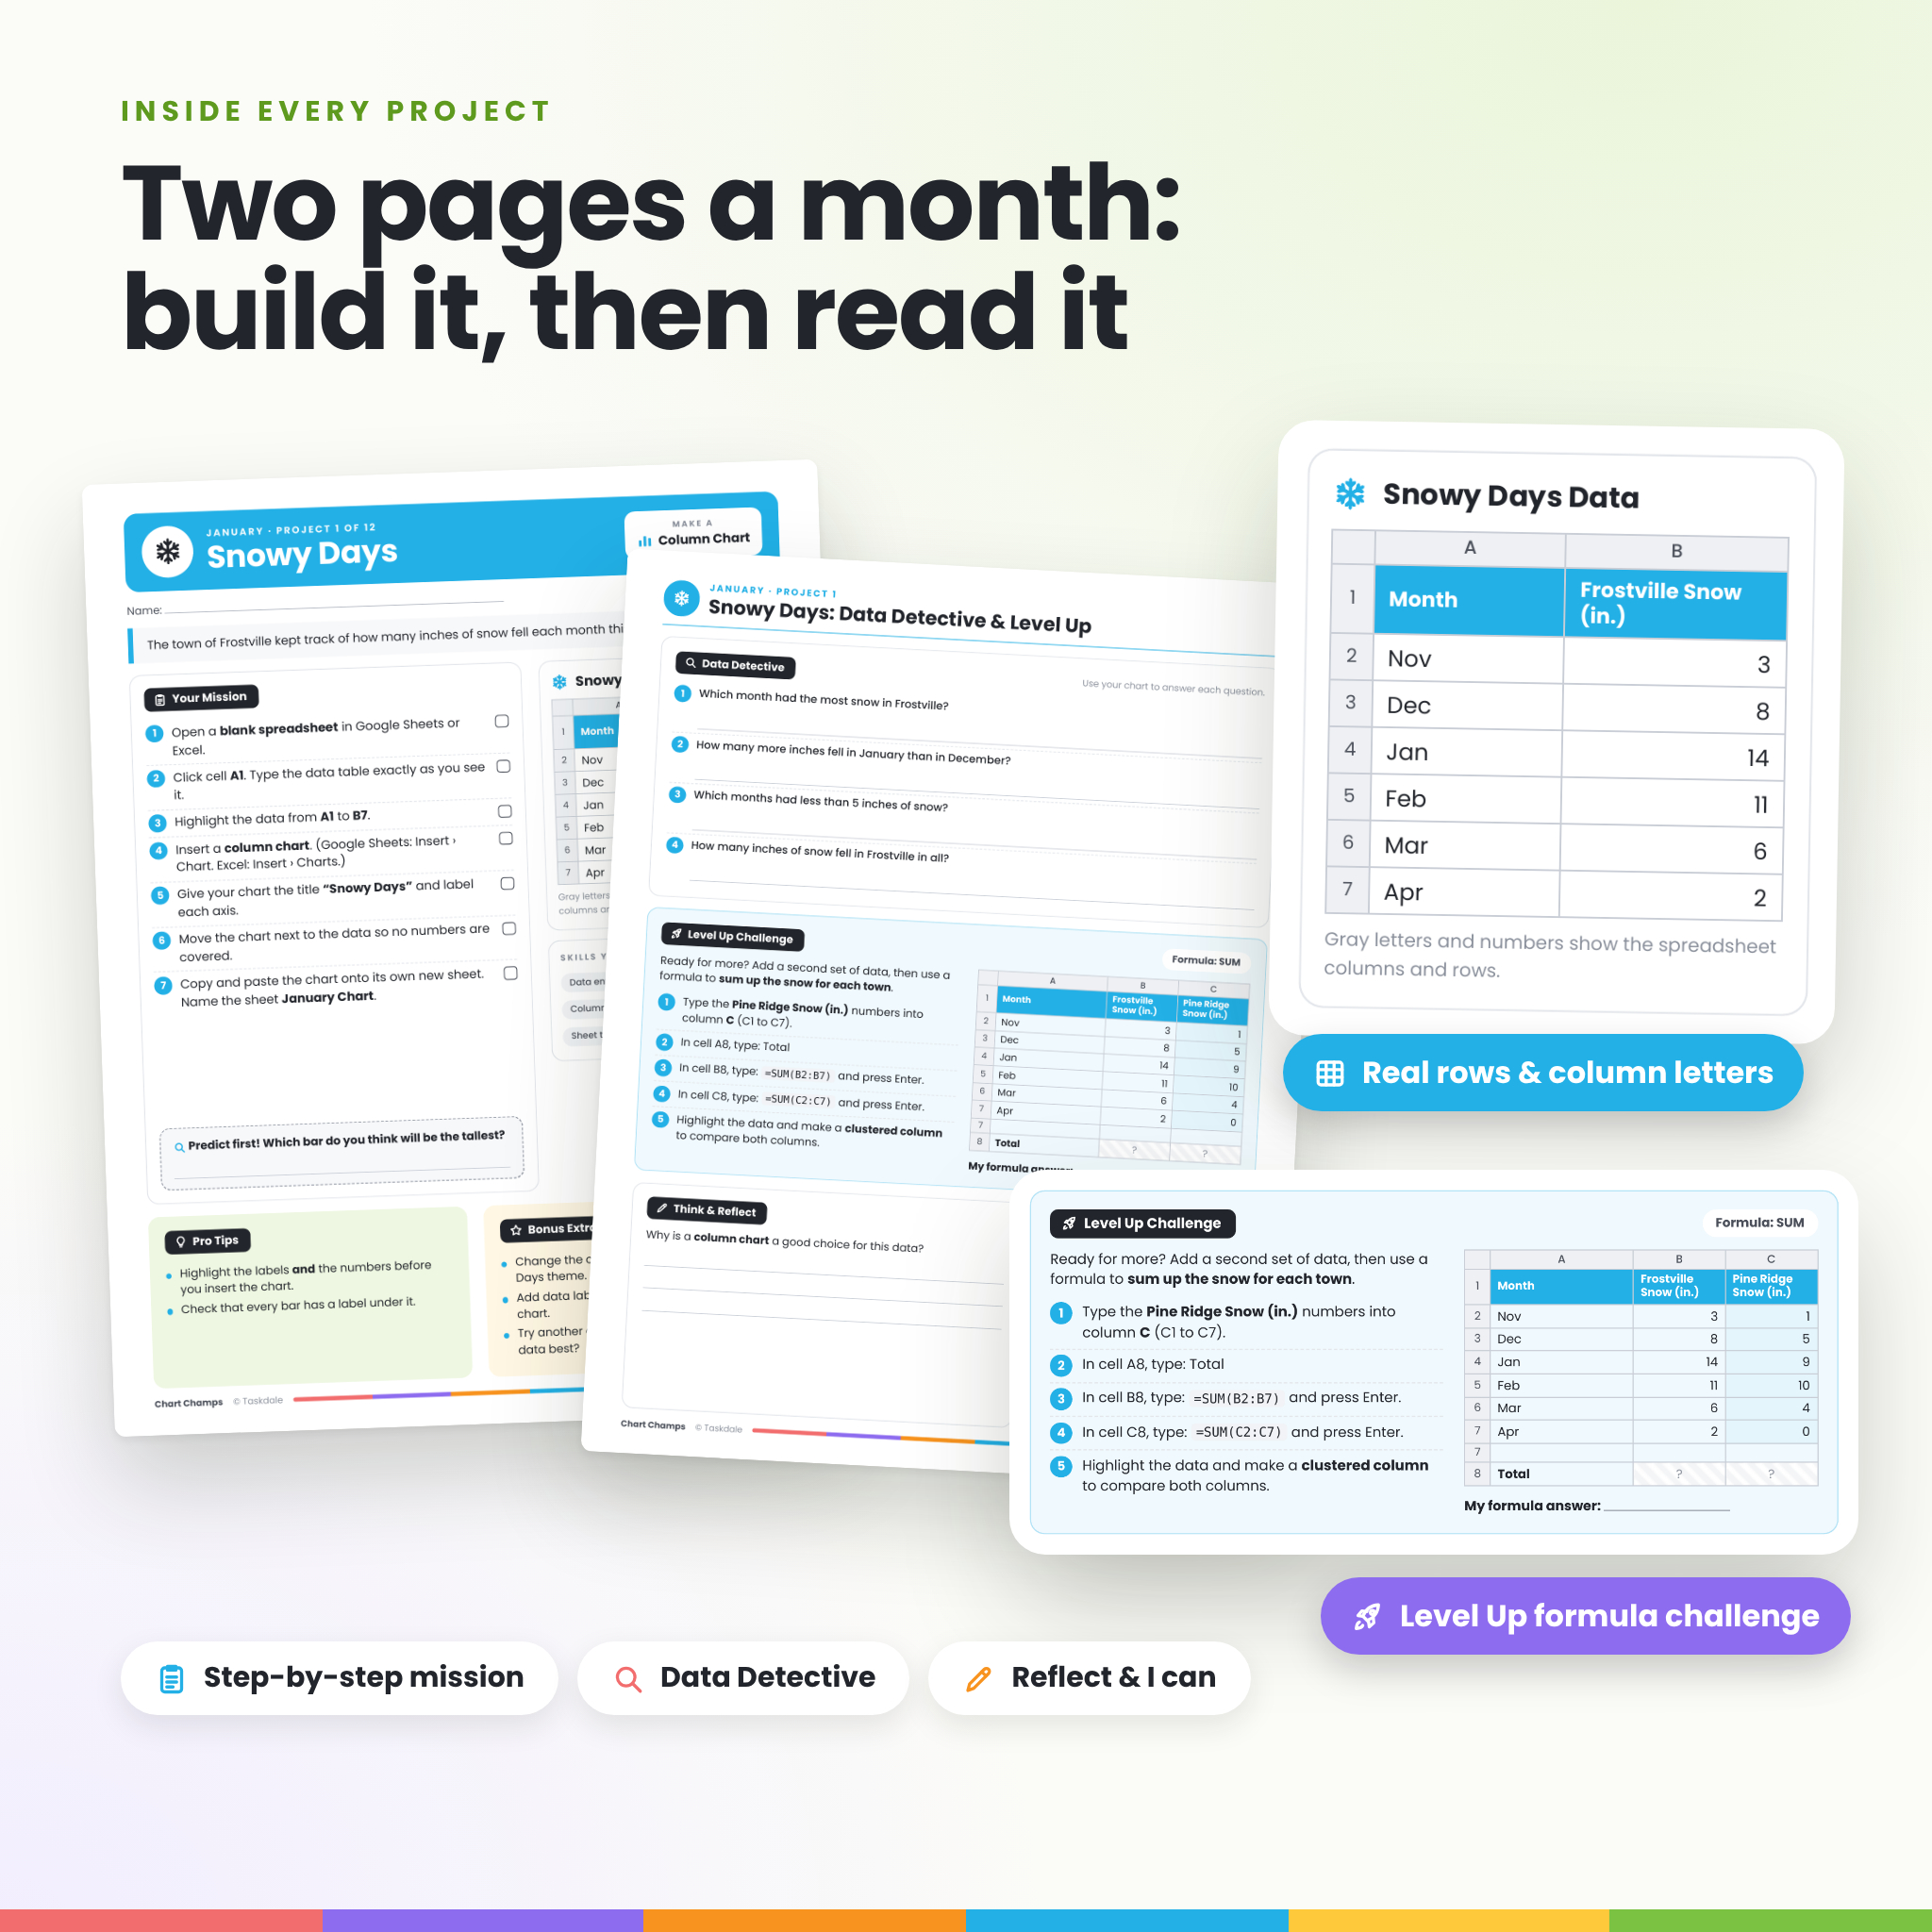
- 12 themed projects, 2 pages each. Page 1 is the core project. Page 2 adds Data Detective questions, a Level Up formula challenge and a short reflection.
- 5 chart types. Column, bar, line, pie and area charts, each matched to data that makes sense for it.
- Real cell references. Every data table is shown with spreadsheet column letters and row numbers, so students see exactly where each value goes.
- Self-checking student workbook. Each row turns green with a check mark when it is typed correctly, or red when it needs another look. Level Up formulas are checked too.
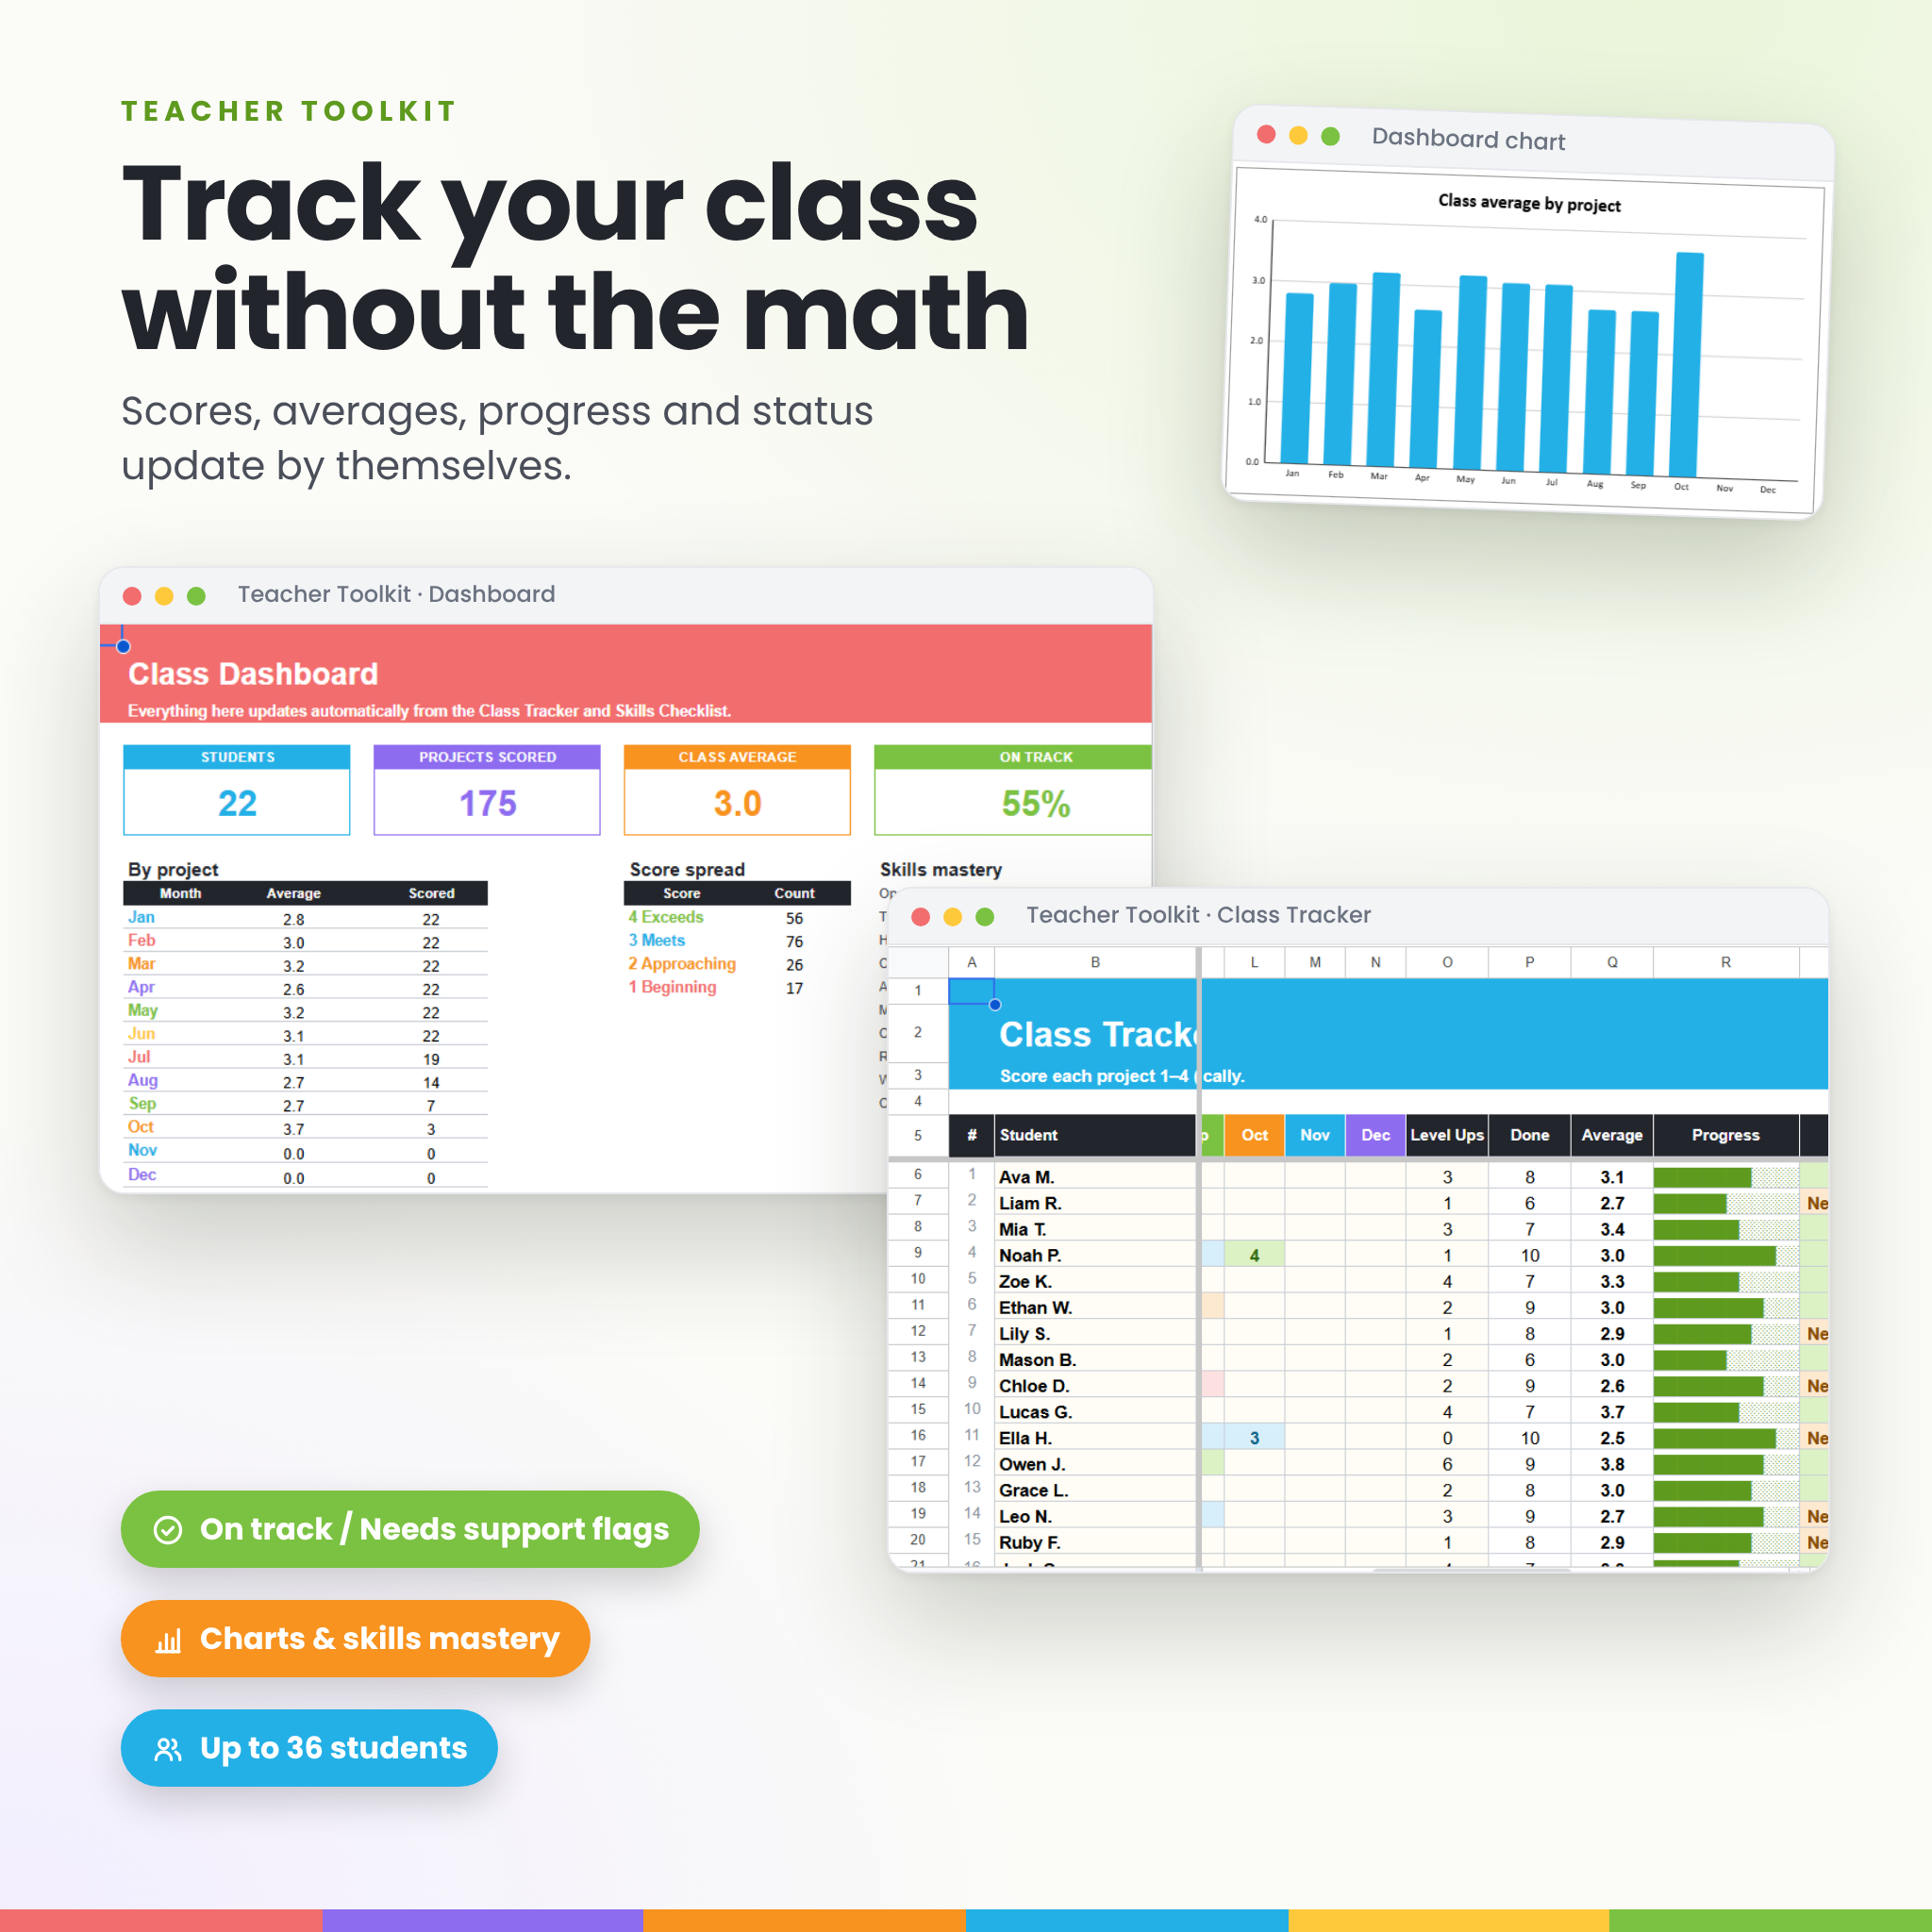
- Teacher Toolkit with a live dashboard. Type scores from 1 to 4 and the tracker works out averages, progress bars, skills mastery and On track / Needs support flags.
- No surveys needed. All of the data is provided, so class time goes to spreadsheet skills instead of collecting numbers.
What is included
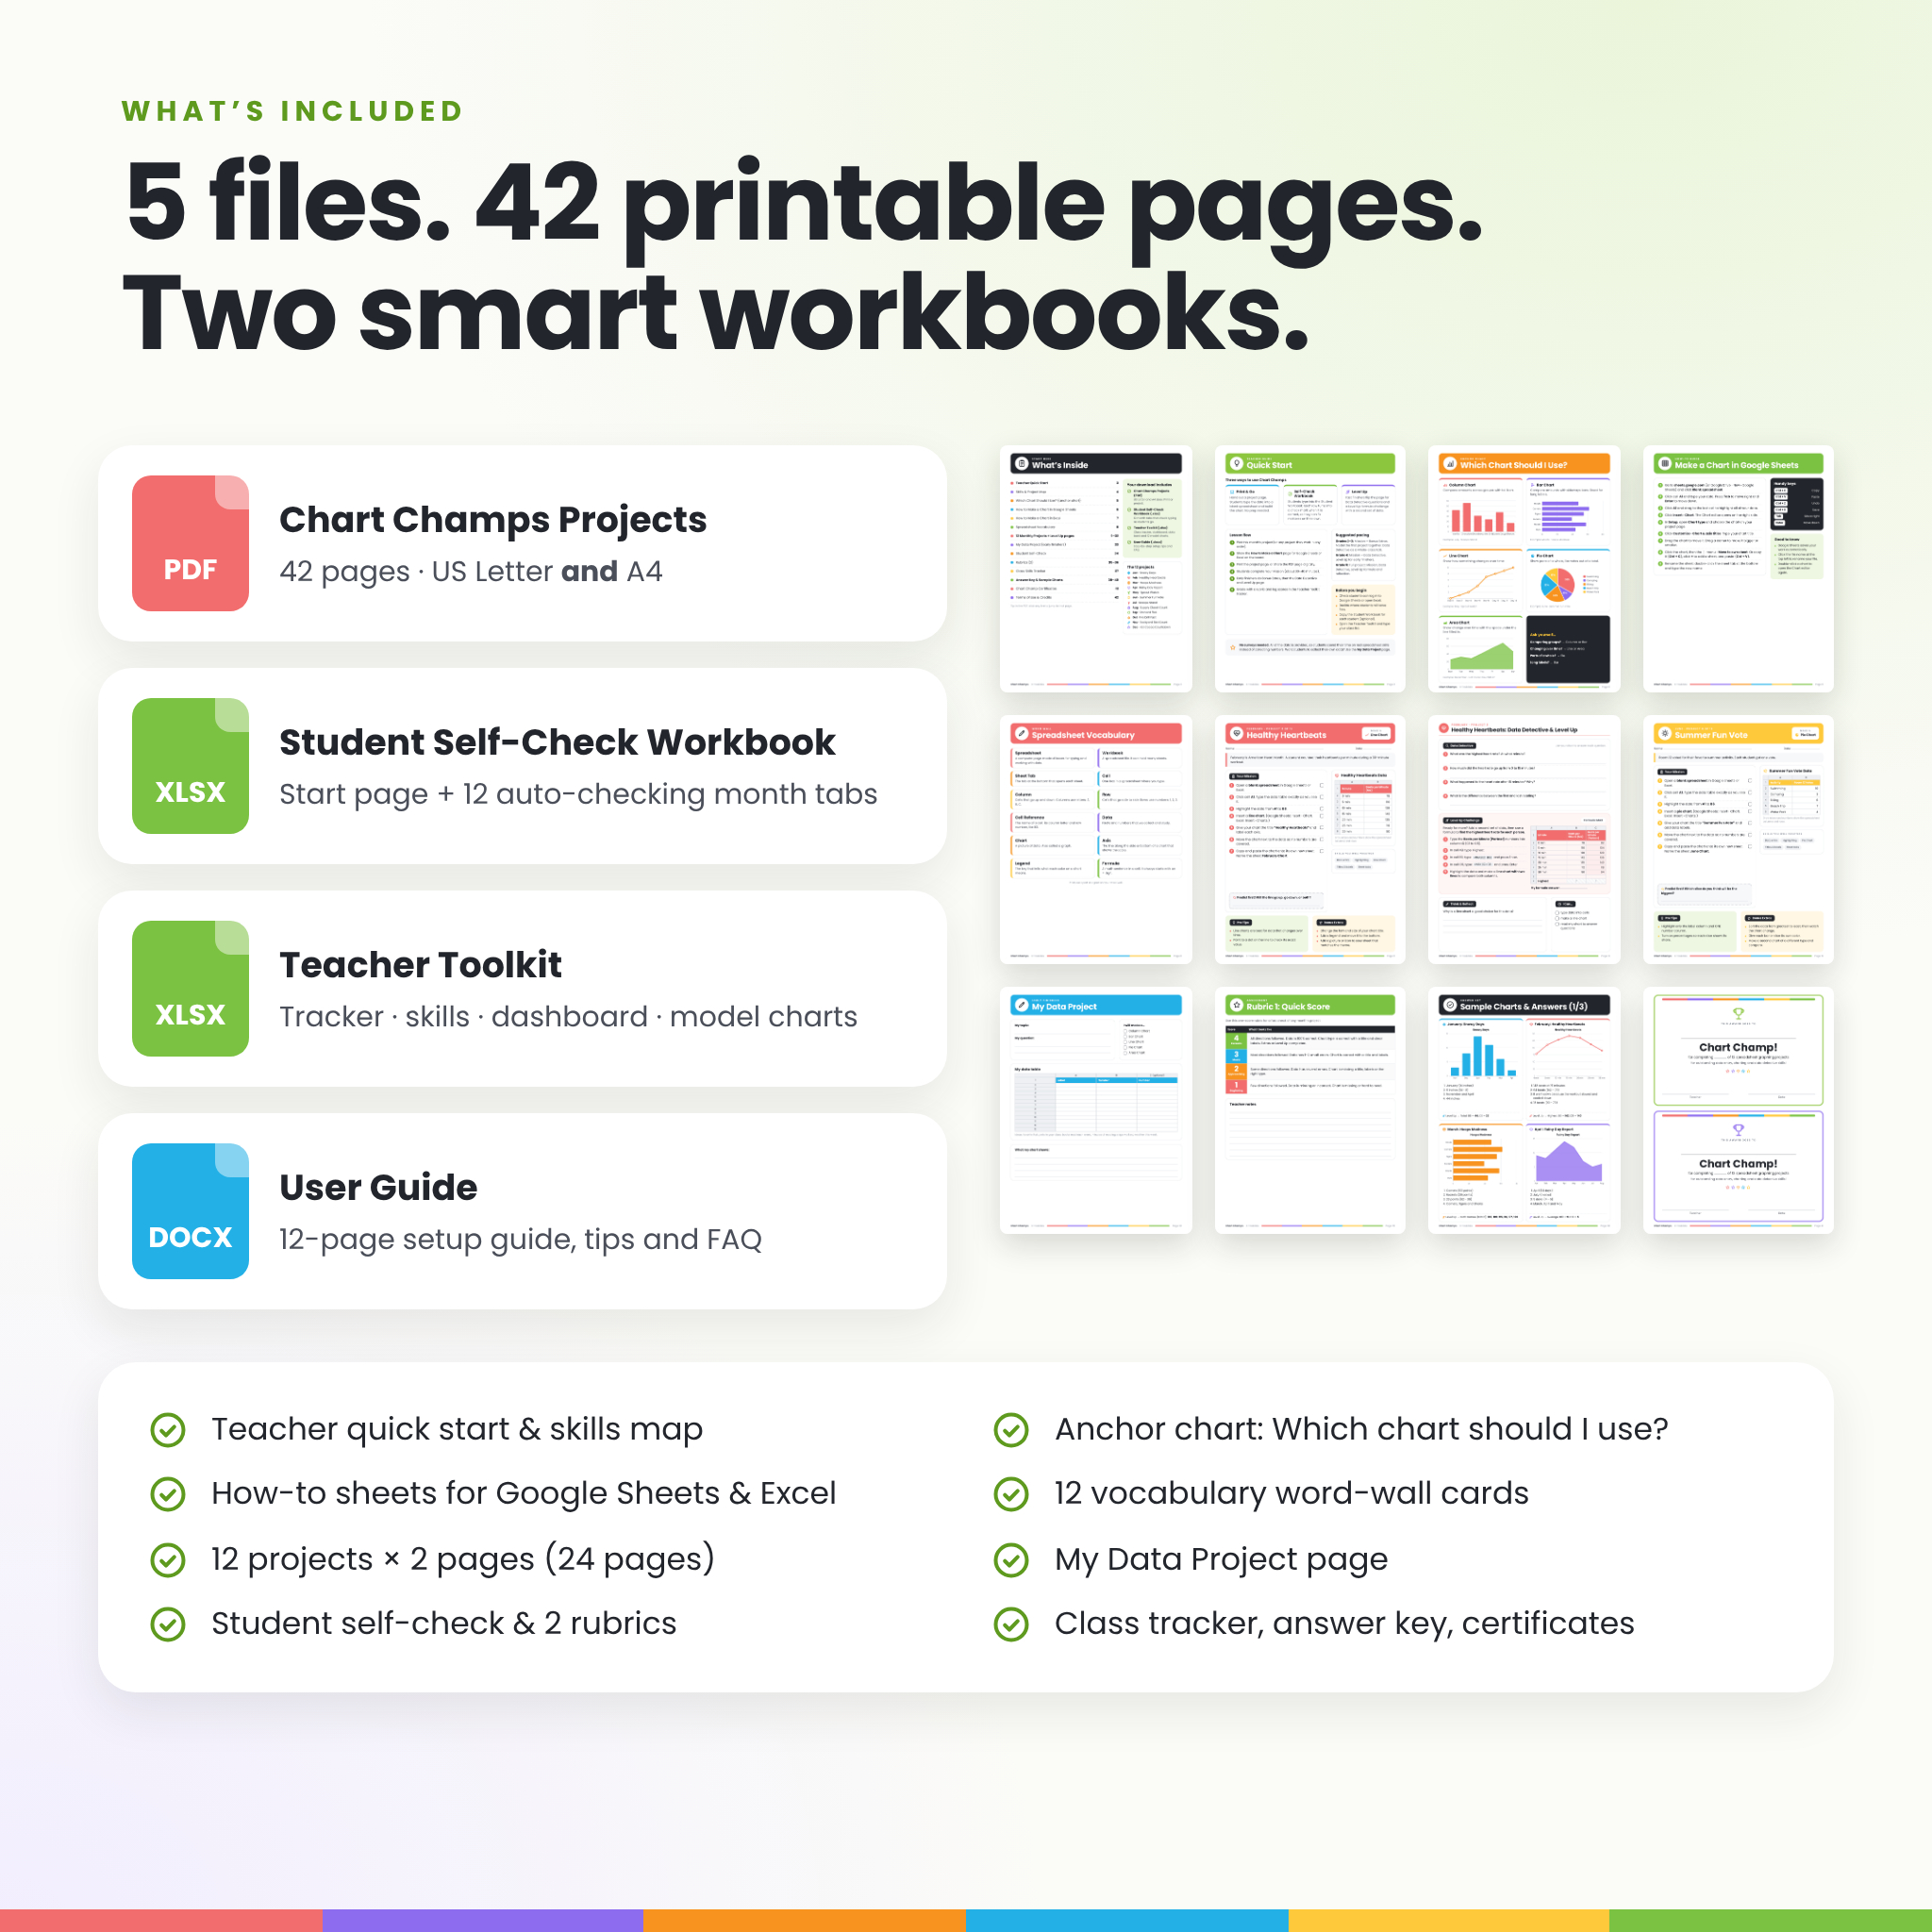
Printable PDF (42 pages, US Letter and A4)
- Teacher Quick Start with three ways to use the projects and pacing for grades 2–5
- Skills and project map with supported standards (ISTE 1.5.b, CCSS 2.MD.D.10 and 3.MD.B.3)
- “Which Chart Should I Use?” anchor chart with examples of all 5 chart types
- Step-by-step How to Make a Chart sheets for Google Sheets and for Excel, with keyboard shortcuts
- 12 spreadsheet vocabulary word-wall cards
- 12 monthly projects × 2 pages (24 pages): story, 7-step mission with check boxes, data table, Predict First box, Pro Tips, Bonus Extras, Data Detective, Level Up and Think & Reflect
- My Data Project planner for early finishers who want to collect their own data
- Student self-check, a quick-score rubric and a skill-by-skill rubric
- Printable class skills tracker
- Answer key with a sample chart and all answers for every month
- Chart Champ award certificates
Student Self-Check Workbook (.xlsx)
- A Start tab with clickable links and a progress summary for all 12 projects
- 12 month tabs that check every row as students type, show a progress bar and give friendly next-step messages
- Level Up checks that confirm a real formula was used, not a typed number
Teacher Toolkit (.xlsx)
- Class Tracker for up to 36 students with score drop-downs, color-coded results, Level Up counts, averages and status
- Skills Checklist for 10 spreadsheet skills with mastery percentages
- Class Dashboard with summary tiles, averages by project, score spread and two charts
- Data Bank with all 12 data sets, Model Charts for every project and a full Answer Key
User Guide (.docx)
A 12-page guide covering setup, every feature, customizing, troubleshooting and FAQs.
The 12 monthly projects
January: Snowy Days (column) · February: Healthy Heartbeats (line) · March: Hoops Madness (bar) · April: Rainy Day Report (area) · May: Sprout Watch (line) · June: Summer Fun Vote (pie) · July: Scoops Stand (column) · August: Supply Closet Count (bar) · September: Orchard Pick (pie) · October: Fire Drill Fast (column) · November: Backyard Bird Count (bar) · December: Hot Cocoa Countdown (area). Themes avoid religious holidays, and every data set has 5 to 8 rows.
Skills students practice
- Opening a blank spreadsheet and typing data into cells
- Highlighting a data range and inserting a chart
- Choosing the right chart type for the data
- Adding chart titles, axis labels, data labels and legends
- Moving, resizing and copying a chart to its own sheet
- Reading a chart to find the most, the least, totals and differences
- Writing SUM, AVERAGE and MAX formulas and simple + and – formulas
- Comparing two sets of data in one chart
How it works
- Open the project. Print the page, share the PDF page, or open the Student Workbook.
- Type the data. Students start in cell A1. In the workbook, every row is checked as they type.
- Make the chart. Highlight the data, insert the chart, add a title and labels, then copy it to its own sheet.
- Read and Level Up. Students answer Data Detective questions, then add a second column and a formula.
- Track progress. Score with a rubric and type the score into the Teacher Toolkit. The dashboard updates by itself.
Use cases
- A monthly computer lab or STEM rotation that builds skills all year
- Math centers for bar graphs, line graphs and “how many more” problems
- Early finisher and enrichment work for gifted and talented groups
- Sub plans: projects are clear enough for a guest teacher to run
- Homeschool or tutoring lessons on spreadsheet basics
- A beginner spreadsheet course for older students in grades 6–8
File formats and requirements
- PDF (US Letter and A4), two .xlsx workbooks and a .docx guide
- The projects work in any spreadsheet program. The workbooks were tested in Google Sheets and in a desktop spreadsheet program using the Excel format. Excel 2013 or newer is recommended.
- Works on Chromebooks, Windows, Mac and iPad (with the Google Sheets or Excel app)
- A free PDF reader to print the projects
Customizing
Type your name, class and school year on the Teacher Toolkit Home tab and set your own on-track score. Formula cells are locked to keep them safe, with no password, so you can unlock and edit anything. Change colors and fonts freely. Use the Mission only for younger students and add Data Detective and Level Up as students grow.
Digital download
This is a digital product. No physical item will be shipped. Your files are available to download right after purchase. The license covers one teacher for use with their own students. Please buy an extra license for each additional teacher.
FAQ
Does it work with Google Sheets and Excel?
Yes. The printable projects work in any spreadsheet program, and both workbooks open in Google Sheets and Excel.
What grades is it for?
Grades 2–5. Pacing tips show how to use it with younger students and how to stretch older students.
Is there an answer key?
Yes. The PDF includes a sample chart and answers for every month, and the Teacher Toolkit has an Answer Key tab and Model Charts.
Can I assign the workbook in Google Classroom?
Yes. Upload the workbook to Google Drive, save it as a Google Sheet, and attach it with “Make a copy for each student.”
How long does each project take?
About 30 to 40 minutes for the main mission, plus 15 to 20 minutes for Data Detective and Level Up.
Do students need to collect data?
No. All data is provided. An optional My Data Project page is included for students who want to collect their own.
Can I print it in color and black and white?
Yes. Pages are designed to print clearly in both.
Reviews
There are no reviews yet.