Best Project Dashboard Excel Templates Compared
The best project dashboard in Excel is one where you type your tasks once and the dashboard, Gantt chart and budget update themselves. For date-driven plans, Waypost is the focused choice. For a wider command centre that also runs in Google Sheets, choose Lumora or Project Command Centre.
Choosing can feel more complicated than it should. Every template promises a "complete" system, and the real differences sit in how dates are calculated, which Excel version you need and how much setup you face. We'll walk through those differences plainly so you can pick with confidence.
Key facts at a glance
- Waypost works in Excel 2010 or newer, uses no macros and calculates dates from working days, skipping weekends and holidays.
- Lumora has 17 tabs, works in Excel 2016 or later or in Google Sheets, and includes a 19-page illustrated user guide.
- Project Command Centre works in Excel and Google Sheets and includes blank copies alongside its dark and light editions.
- All three build a dashboard and a Gantt chart from the tasks you enter, so you don't draw anything by hand.
- Waypost is the only one of the three that lists baseline, slip and forecast finish tracking.
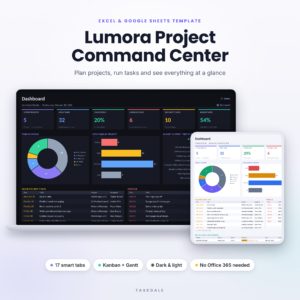
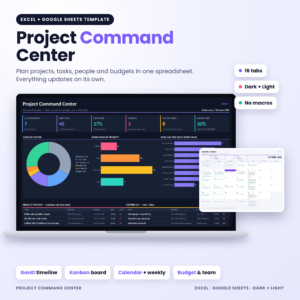
Table of Contents Toggle
- What is a project dashboard in Excel?
- What should you look for in the best project dashboard Excel template?
- How do the three templates compare?
- Who does each template suit?
- How do you set up and use an Excel project dashboard?
- What mistakes should you avoid?
- What affects the price of a project dashboard template?
- Which project dashboard Excel template should you choose?
- Common questions
What is a project dashboard in Excel?
A project dashboard in Excel is a single summary sheet that pulls figures from your task list and shows progress, deadlines, workload and budget at a glance. It replaces the habit of opening five separate files to answer "are we on track?"
The good ones are built from formulas and charts rather than manual typing. That distinction matters. A dashboard you have to update by hand soon falls behind the work, and an out-of-date dashboard is worse than none because people trust it.
What should you look for in the best project dashboard Excel template?
Look for four things: how dates are calculated, where the file will actually run, how many views are fed from one task list, and how much guidance you get. Each one affects whether you'll still be using the template in month three.
How are dates calculated?
The best templates take a duration and a predecessor and work out the dates for you. Waypost does this with durations in working days and the task each one follows, then skips weekends and holidays and draws the Gantt chart. If one task slips, everything after it moves.
Without that logic, a Gantt chart is only a picture you maintain by hand.
Will it run in your version of Excel or in Google Sheets?
Check this before anything else. Waypost needs Excel 2010 or newer and uses no macros. Lumora needs Excel 2016 or later, so you don't need a Microsoft 365 subscription, and it also works in Google Sheets. Project Command Centre is listed for Excel and Google Sheets.
If your team shares files online and some people don't own Excel, the Google Sheets option decides the matter.
Does one task list feed every view?
A single task list that feeds the dashboard, Gantt chart, Kanban board and calendars saves you from entering the same task twice. Lumora and Project Command Centre both work this way. Lumora adds monthly and weekly calendars, a budget tracker and a team workload view; Project Command Centre adds a priority matrix, calendars, workload, budget and a risk log.
More views only help if you will open them. Be honest about whether you want a calendar, a workload view and a risk log, or just dates and progress.
What guidance comes with it?
A template is only as useful as your ability to set it up in an afternoon. Lumora includes a 19-page illustrated user guide. Project Command Centre includes a step-by-step user guide and blank copies, so you can keep a clean version to reuse. Waypost lists 12 tabs including a status report, but no separate guide is mentioned in its details, so expect to learn it by using it.
How do the three templates compare?
The three templates differ mainly in date logic, platform and breadth. This table sets out only what each listing states.
| Product | Works in | Tabs and editions | Standout features |
|---|---|---|---|
 Gantt Chart Excel Template & Project Management Tracker | Waypost Project Planner | Excel 2010 or newer, no macros | 12 tabs | Working-day scheduling, holidays, baseline, slip, forecast finish, progress vs plan, status report, kanban, workload, budget, risks, meetings |
| Project Management Spreadsheet for Excel & Google Sheets | Lumora Project Command Centre with Gantt Chart, Kanban Board, Task Tracker, Budget & Dashboard | Excel 2016 or later, Google Sheets | 17 tabs, dark and light editions | Recurring tasks, automatic priority matrix, monthly and weekly calendars, budget, team workload, 19-page guide |
| Project Command Centre | Project Management Spreadsheet for Excel & Google Sheets | Dark Mode Project Planner with Gantt Chart, Kanban Board, Task Tracker & Team Workload | Excel and Google Sheets | Dark and light editions, blank copies | Dashboard, Gantt, Kanban, priority matrix, calendars, workload, budget, risk log, step-by-step guide |
Browse all 3 options on this page to see how each is presented.
Who does each template suit?
Waypost suits people whose projects are driven by deadlines and dependencies. Lumora suits people who want one workbook covering planning, tasks and budget, in either Excel or Google Sheets. Project Command Centre suits people who want the same style of workbook with blank copies and a dark mode option.
Waypost. Think of a house renovation, a product launch or an event where one late task shifts everything behind it. The baseline, slip and forecast finish tracking lets you see how far you've moved from the original plan. The status report tab helps if you send updates to someone else. It's also the option to pick if your company is still on an older Excel, since it goes back to 2010.
Lumora. This is the better fit for a small team juggling several projects at once. Recurring tasks help with repeating work such as monthly reporting, and the priority matrix sorts what to do first without you arguing about it. The Google Sheets option helps if colleagues don't have Excel.
Project Command Centre. This suits someone who wants to set up once and then reuse. The blank copies mean you can start a second project from a clean file. The risk log is listed here too, which helps if you want to record what could go wrong alongside the tasks.
How do you set up and use an Excel project dashboard?
You set up a project dashboard by entering tasks once, checking the dates, then updating progress at a regular time each week. The steps are similar across all three templates.
- Save a copy of the file before you change anything, and keep the original as your clean version.
- Enter your project name and start date, then your team members if the template has a workload view.
- Type each task with its duration and owner. In Waypost, add the task it follows so the dates calculate.
- Add holidays or non-working days where the template allows it, so the Gantt chart reflects real calendars.
- Open the dashboard and check that the dates look right before you share it.
- Update percentage complete once a week, on the same day, and let the dashboard recalculate.
What mistakes should you avoid?
The most common mistakes are overbuilding, skipping dependencies and letting the file go stale. Each is easy to avoid once you know it.
- Entering every tiny job. A plan with 300 one-line tasks is hard to read. Group small jobs into tasks that last at least a day.
- Leaving out predecessors. If you type dates directly instead of letting the template calculate them, you lose the benefit of automatic rescheduling.
- Ignoring the Excel version. A template that needs Excel 2016 will not behave properly in an older copy. Check before you download.
- Editing formulas. Type only into the input cells. Changing a formula tab is the quickest way to break a dashboard.
- Updating monthly. A weekly check keeps the numbers believable. A monthly one lets problems hide.
What affects the price of a project dashboard template?
The main things that affect price are the number of tabs, the amount of automation and the support material included. A workbook with a budget tracker, workload view and guide generally costs more up front than a basic task tracker.
Platform support also plays a part. A template that works in both Excel and Google Sheets has been built and tested twice. Because these are instant digital downloads, you pay once for the file rather than a monthly subscription, though check each listing for its own terms. The live product cards show current prices, so compare them there.
Which project dashboard Excel template should you choose?
Choose Waypost if your plan depends on dates and dependencies. Choose Lumora if you want the widest set of views with a detailed guide. Choose Project Command Centre if you want a similar all-in-one workbook with blank copies and a risk log.
A simple rule: if you'd be upset by a late task silently moving your finish date, take Waypost. If you work from Google Sheets or share files with people who don't use Excel, take one of the other two.
Common questions
Do I need Microsoft 3 to use these templates?
No. Lumora states it works in Excel 2016 or later, so a Microsoft 365 subscription isn't required. Waypost works in Excel 2010 or newer without macros. Project Command Centre is listed for Excel and Google Sheets, so check your version against the listing.
Can I use a project dashboard template in Google Sheets?
Yes, for two of the three. Lumora and Project Command Centre both state they work in Excel and Google Sheets. Waypost is described as an Excel template, so if you need Google Sheets, choose one of the other two.
Do these templates include a Gantt chart?
Yes, all three do. The Gantt chart is built from the tasks you enter rather than drawn by hand. Waypost calculates dates from working-day durations and predecessors, skipping weekends and holidays, so the chart moves when a task slips.
What is the difference between a dashboard and a Gantt chart?
A Gantt chart shows tasks as bars on a timeline, so you can see order and overlap. A dashboard summarises the whole project, such as progress, workload and budget. These templates provide both, and the dashboard reads from the same task list.
Can I reuse the template for a second project?
Yes, if you keep a clean copy. Project Command Centre includes blank copies for this purpose. With the others, save an untouched original before you start, then make a fresh copy for each new project so old tasks don't carry over.