Craft Fair Profit & Break-Even Planner: know your number before you book the booth
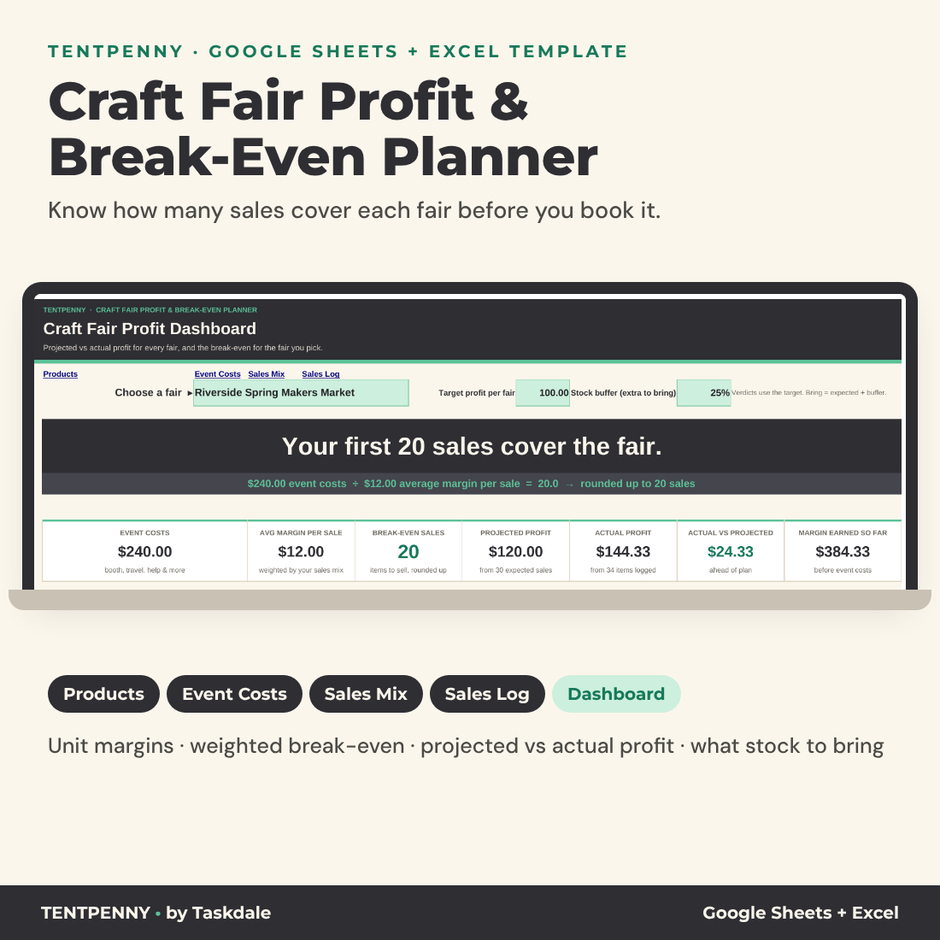
Every maker has asked the same question in a hot tent at 2 p.m.: have I even covered the booth fee yet? Tentpenny is a craft fair profit and break-even planner for Google Sheets and Excel that answers it before you apply. It turns your booth fee, mileage, parking, meals and paid help into one clear line: “Your first 20 sales cover the fair.” Then it shows the profit you can expect, how much of each product to pack, and, after the fair, whether it actually paid.
It is built for potters, jewelers, candle and soap makers, woodworkers, knitters, illustrators and any small handmade business deciding which craft fairs, markets, pop-ups and holiday bazaars to book and what stock to bring.
What the planner does
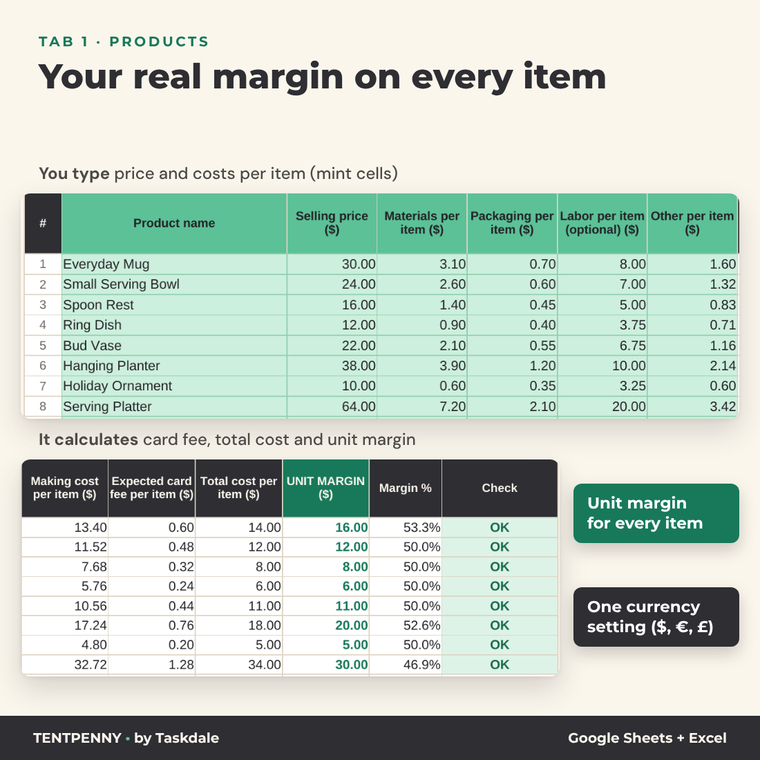
- Calculates unit margins for up to 40 products: selling price minus materials, packaging, optional labor, other costs and the expected card fee.
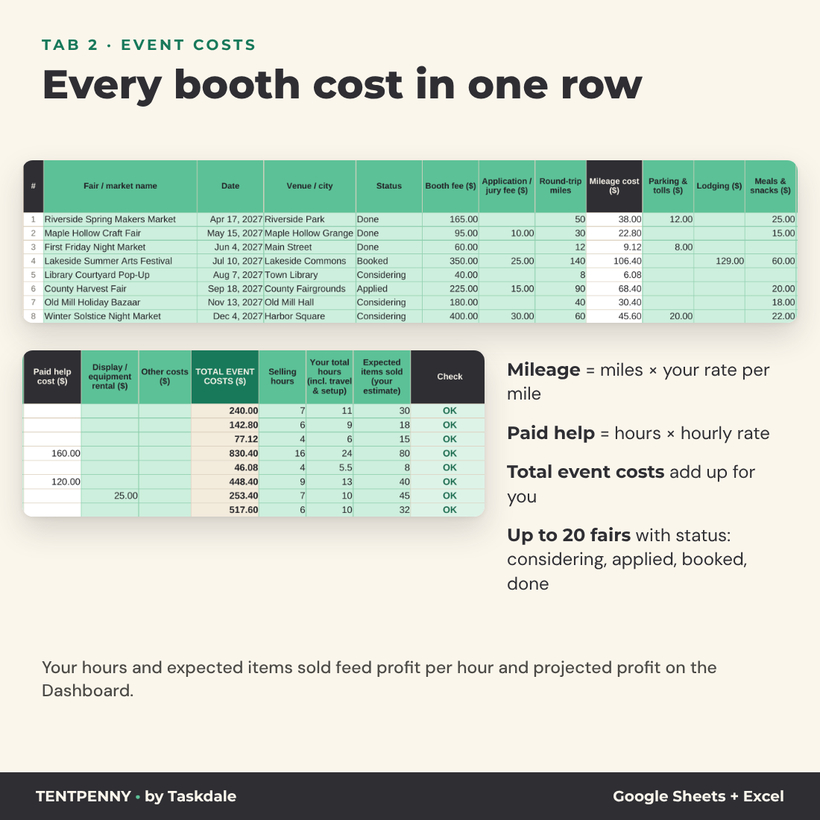
- Totals every event cost for up to 20 fairs: booth fee, application or jury fee, round-trip mileage at your rate, parking, lodging, meals, paid help at an hourly rate, display rental and other costs.
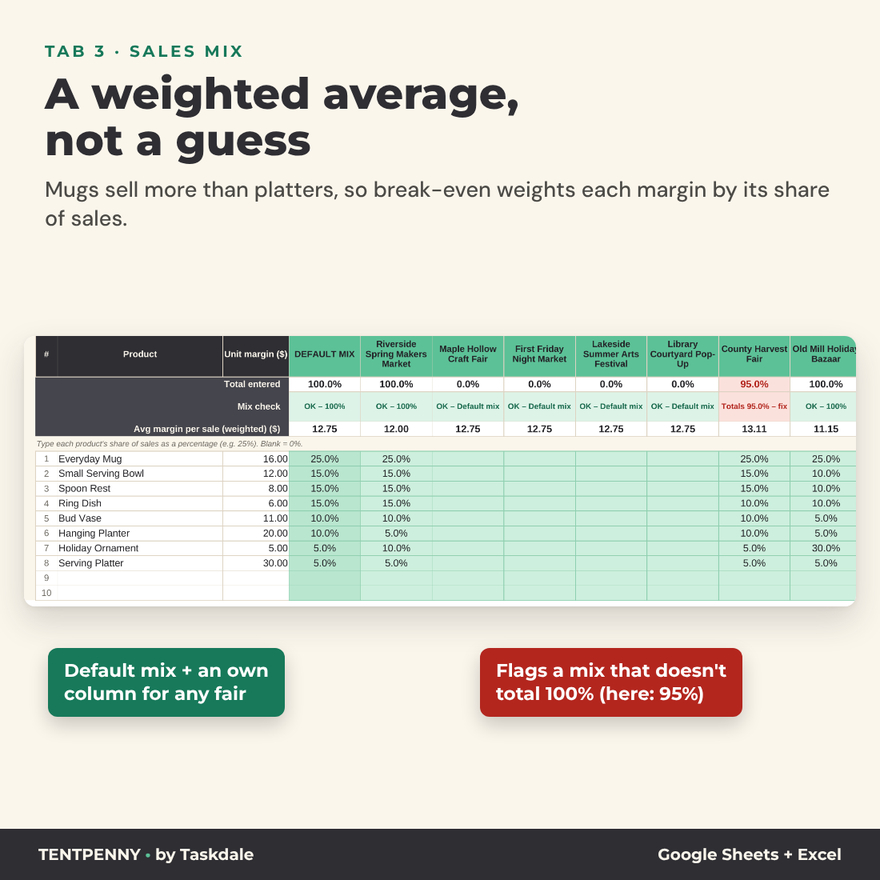
- Weights your margin by your sales mix. You sell more mugs than platters, so the planner multiplies each product’s margin by its share of sales to get a realistic average margin per sale.
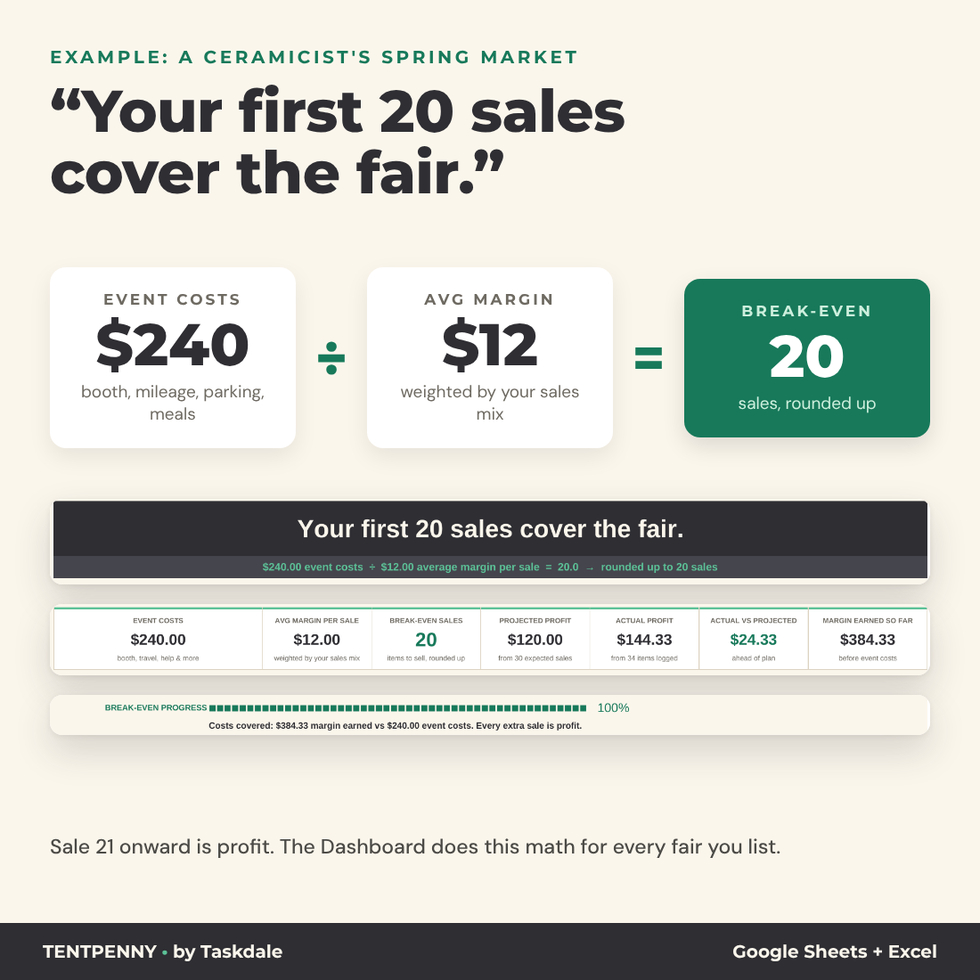
- Calculates break-even sales: event costs ÷ weighted average unit margin, rounded up to a whole item.
- Flags a sales mix that doesn’t total 100% in red on the Sales Mix tab, on the Dashboard and in the fair’s verdict.
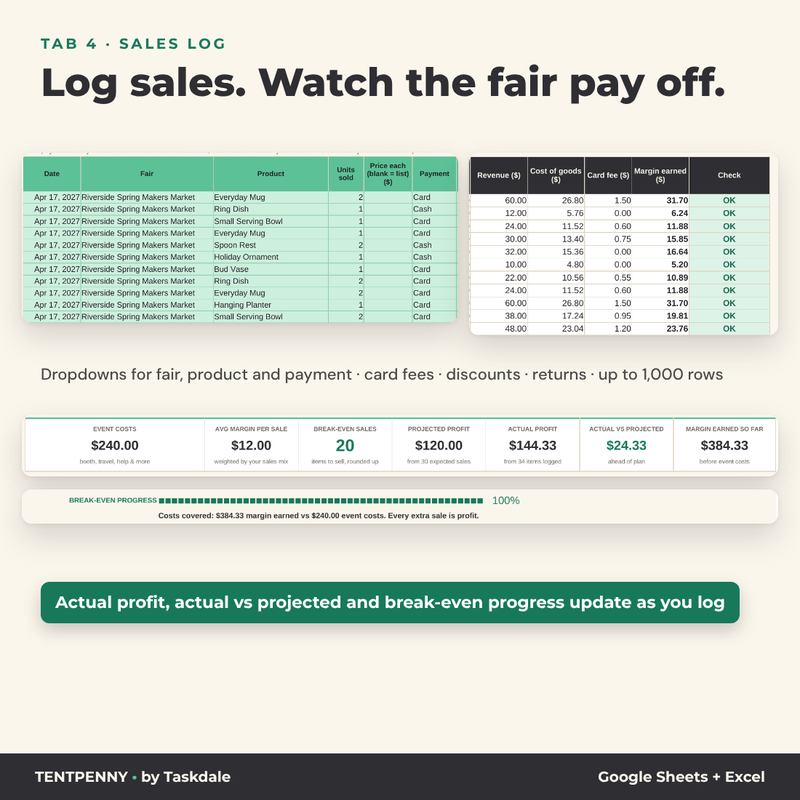
- Logs units sold at the booth with revenue, cost of goods, card fees and margin earned.
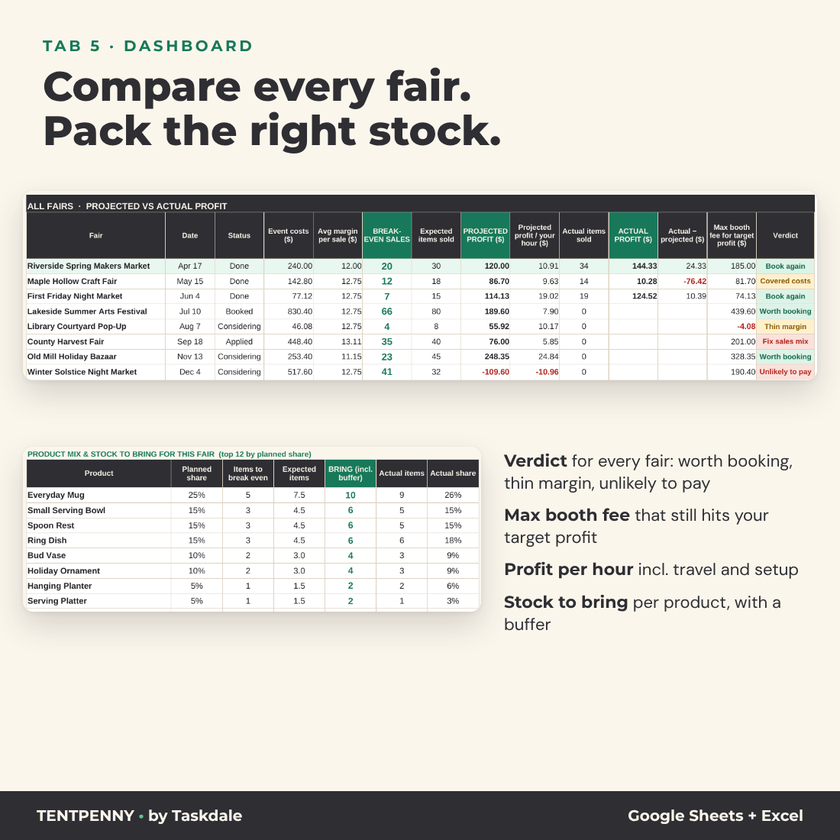
- Compares projected and actual profit for every fair on the Dashboard, with a chart.
The five tabs
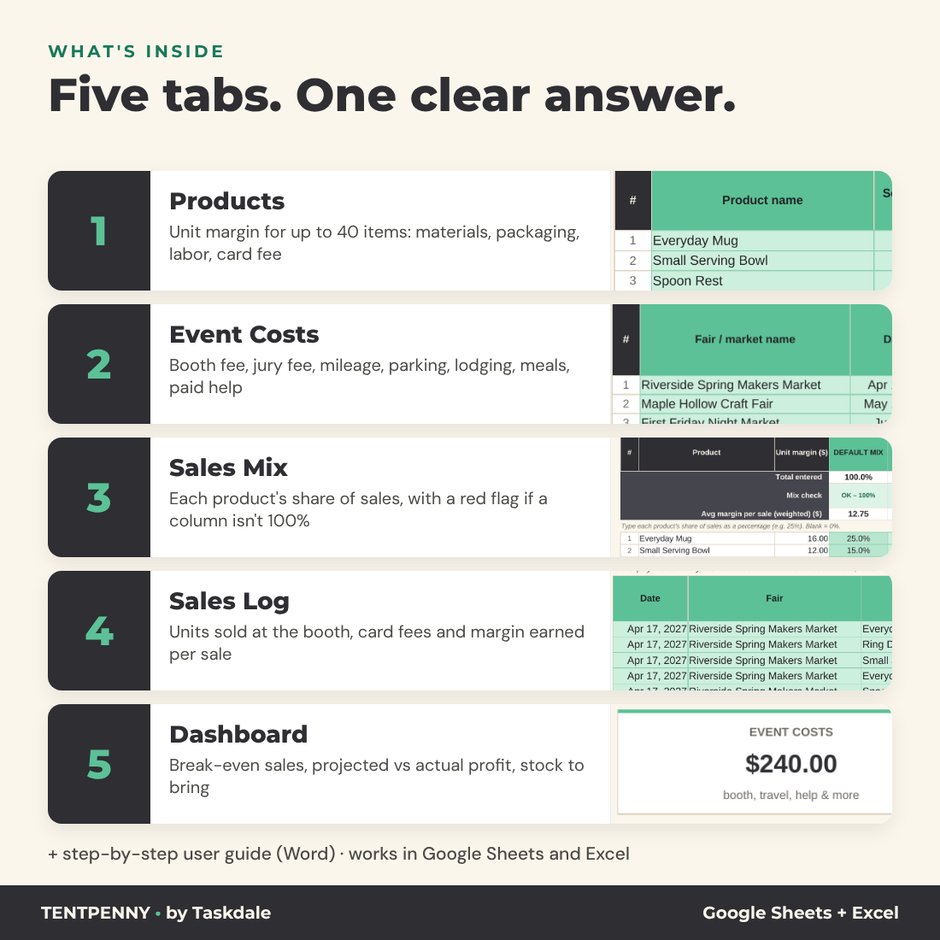
1. Products
One row per item. Type the price and per-item costs in the mint cells; making cost, expected card fee, total cost, unit margin and margin % calculate. A Check column flags missing prices, duplicate names and items that lose money. The currency symbol, card fee % and share of sales paid by card sit at the top of this tab.
2. Event Costs
One row per fair with date, venue and status (Considering, Applied, Booked, Done, Skipped). Mileage = miles × your rate per mile; paid help = hours × hourly rate. Add your selling hours, your total hours including travel and setup, and the number of items you expect to sell.
3. Sales Mix
Each product’s share of sales. Fill a Default mix once, then give any fair its own column if you expect to sell differently (more ornaments at a holiday bazaar, for example). Every column shows its total, a 100% check and the weighted average margin per sale.
4. Sales Log
Record sales one by one or as end-of-day counts. Fair, product and payment come from dropdowns. Leave the price blank to use the list price, or type a discount price. Card payments carry your card fee; negative units record a return. Up to 1,000 rows.
5. Dashboard
Pick a fair to see the break-even headline with the math behind it, seven KPI cards (event costs, average margin, break-even sales, projected profit, actual profit, actual vs projected, margin earned so far), a break-even progress bar, and a product table with items to break even, expected items and how many to bring with your stock buffer. Below it, every fair sits side by side with projected profit, profit per hour of your time, actual profit, the highest booth fee that still meets your target profit, and a verdict: Worth booking, Thin margin, Unlikely to pay, Book again, Covered costs or Lost money.
Example: a ceramicist’s spring market
A small ceramics studio books a spring makers market. Booth fee $165, 50 round-trip miles at $0.76, $12 parking and $25 for meals: $240 in event costs. With mugs, bowls, spoon rests, ring dishes, vases, planters, ornaments and platters in its mix, the weighted average margin is $12 per sale. $240 ÷ $12 = 20, so the Dashboard reads: “Your first 20 sales cover the fair.” Thirty expected sales means about $120 projected profit; the logged sales show what really happened. (The worked numbers in the listing images are fictional sample data.)
Why makers choose Tentpenny
- A weighted break-even, not a guess. Many calculators divide costs by one average price. Tentpenny weights every product’s margin by how often it actually sells.
- Compare fairs before you pay. Projected profit, profit per hour and maximum booth fee for up to 20 fairs at once.
- Plan, then check. Projected vs actual profit shows which fairs are worth booking again.
- Pack with confidence. Stock to bring per product, never fewer than you need to break even.
- Beginner friendly. Mint cells for typing, locked formulas, dropdowns, plain-English checks.
What’s included
- Tentpenny Craft Fair Profit & Break-Even Planner (.xlsx) with 5 tabs, clean and ready for your data
- User guide (Word .docx) with screenshots, the break-even math, troubleshooting and FAQs
File format and software
One .xlsx file that works in Google Sheets (import it into your Google Drive) and Microsoft Excel 2016 or newer, including Microsoft 365 on Windows and Mac. It uses standard functions only: no macros, scripts, add-ons or external links. A free Google account is enough for Google Sheets.
Customization
Set your own currency symbol ($, €, £ and more), card fee %, mileage rate, default helper rate, target profit per fair and stock buffer. Sheets are protected without a password, so you can unlock them to change colors or layout.
Digital download
This is a digital product. No physical item ships. You can download the files right after purchase from your account and order email.
FAQ
Does it work in Google Sheets?
Yes. Upload the .xlsx file to Google Drive and save it as a Google Sheet. Formulas, dropdowns, colors and charts carry over.
How is break-even calculated?
Event costs divided by your weighted average unit margin, rounded up to a whole sale. The weights come from your sales mix.
What if my sales mix doesn’t add up to 100%?
The planner flags it in red on the Sales Mix tab and the Dashboard, and the fair’s verdict says “Fix sales mix” until you correct it.
How many fairs and products can I track?
Up to 20 fairs, 40 products and 1,000 Sales Log rows per file. Save a fresh copy each season.
Does it handle card processing fees?
Yes. Enter your processor’s percentage. Projections use your share of card sales; the Sales Log charges the fee only on Card payments.
Does it calculate sales tax or income tax?
No. It is a planning tool. Leave sales tax you collect out of your prices and sales.
Is it suitable for beginners?
Yes. You only type in mint cells, and the user guide walks you through a full example.
License: personal use only (or use within your own business). You may not resell, share, or redistribute the files. © 2026 Taskdale. Planning estimates only; not tax, legal or accounting advice.

Reviews
There are no reviews yet.