

Small Business KPI Dashboard for Excel and Google Sheets
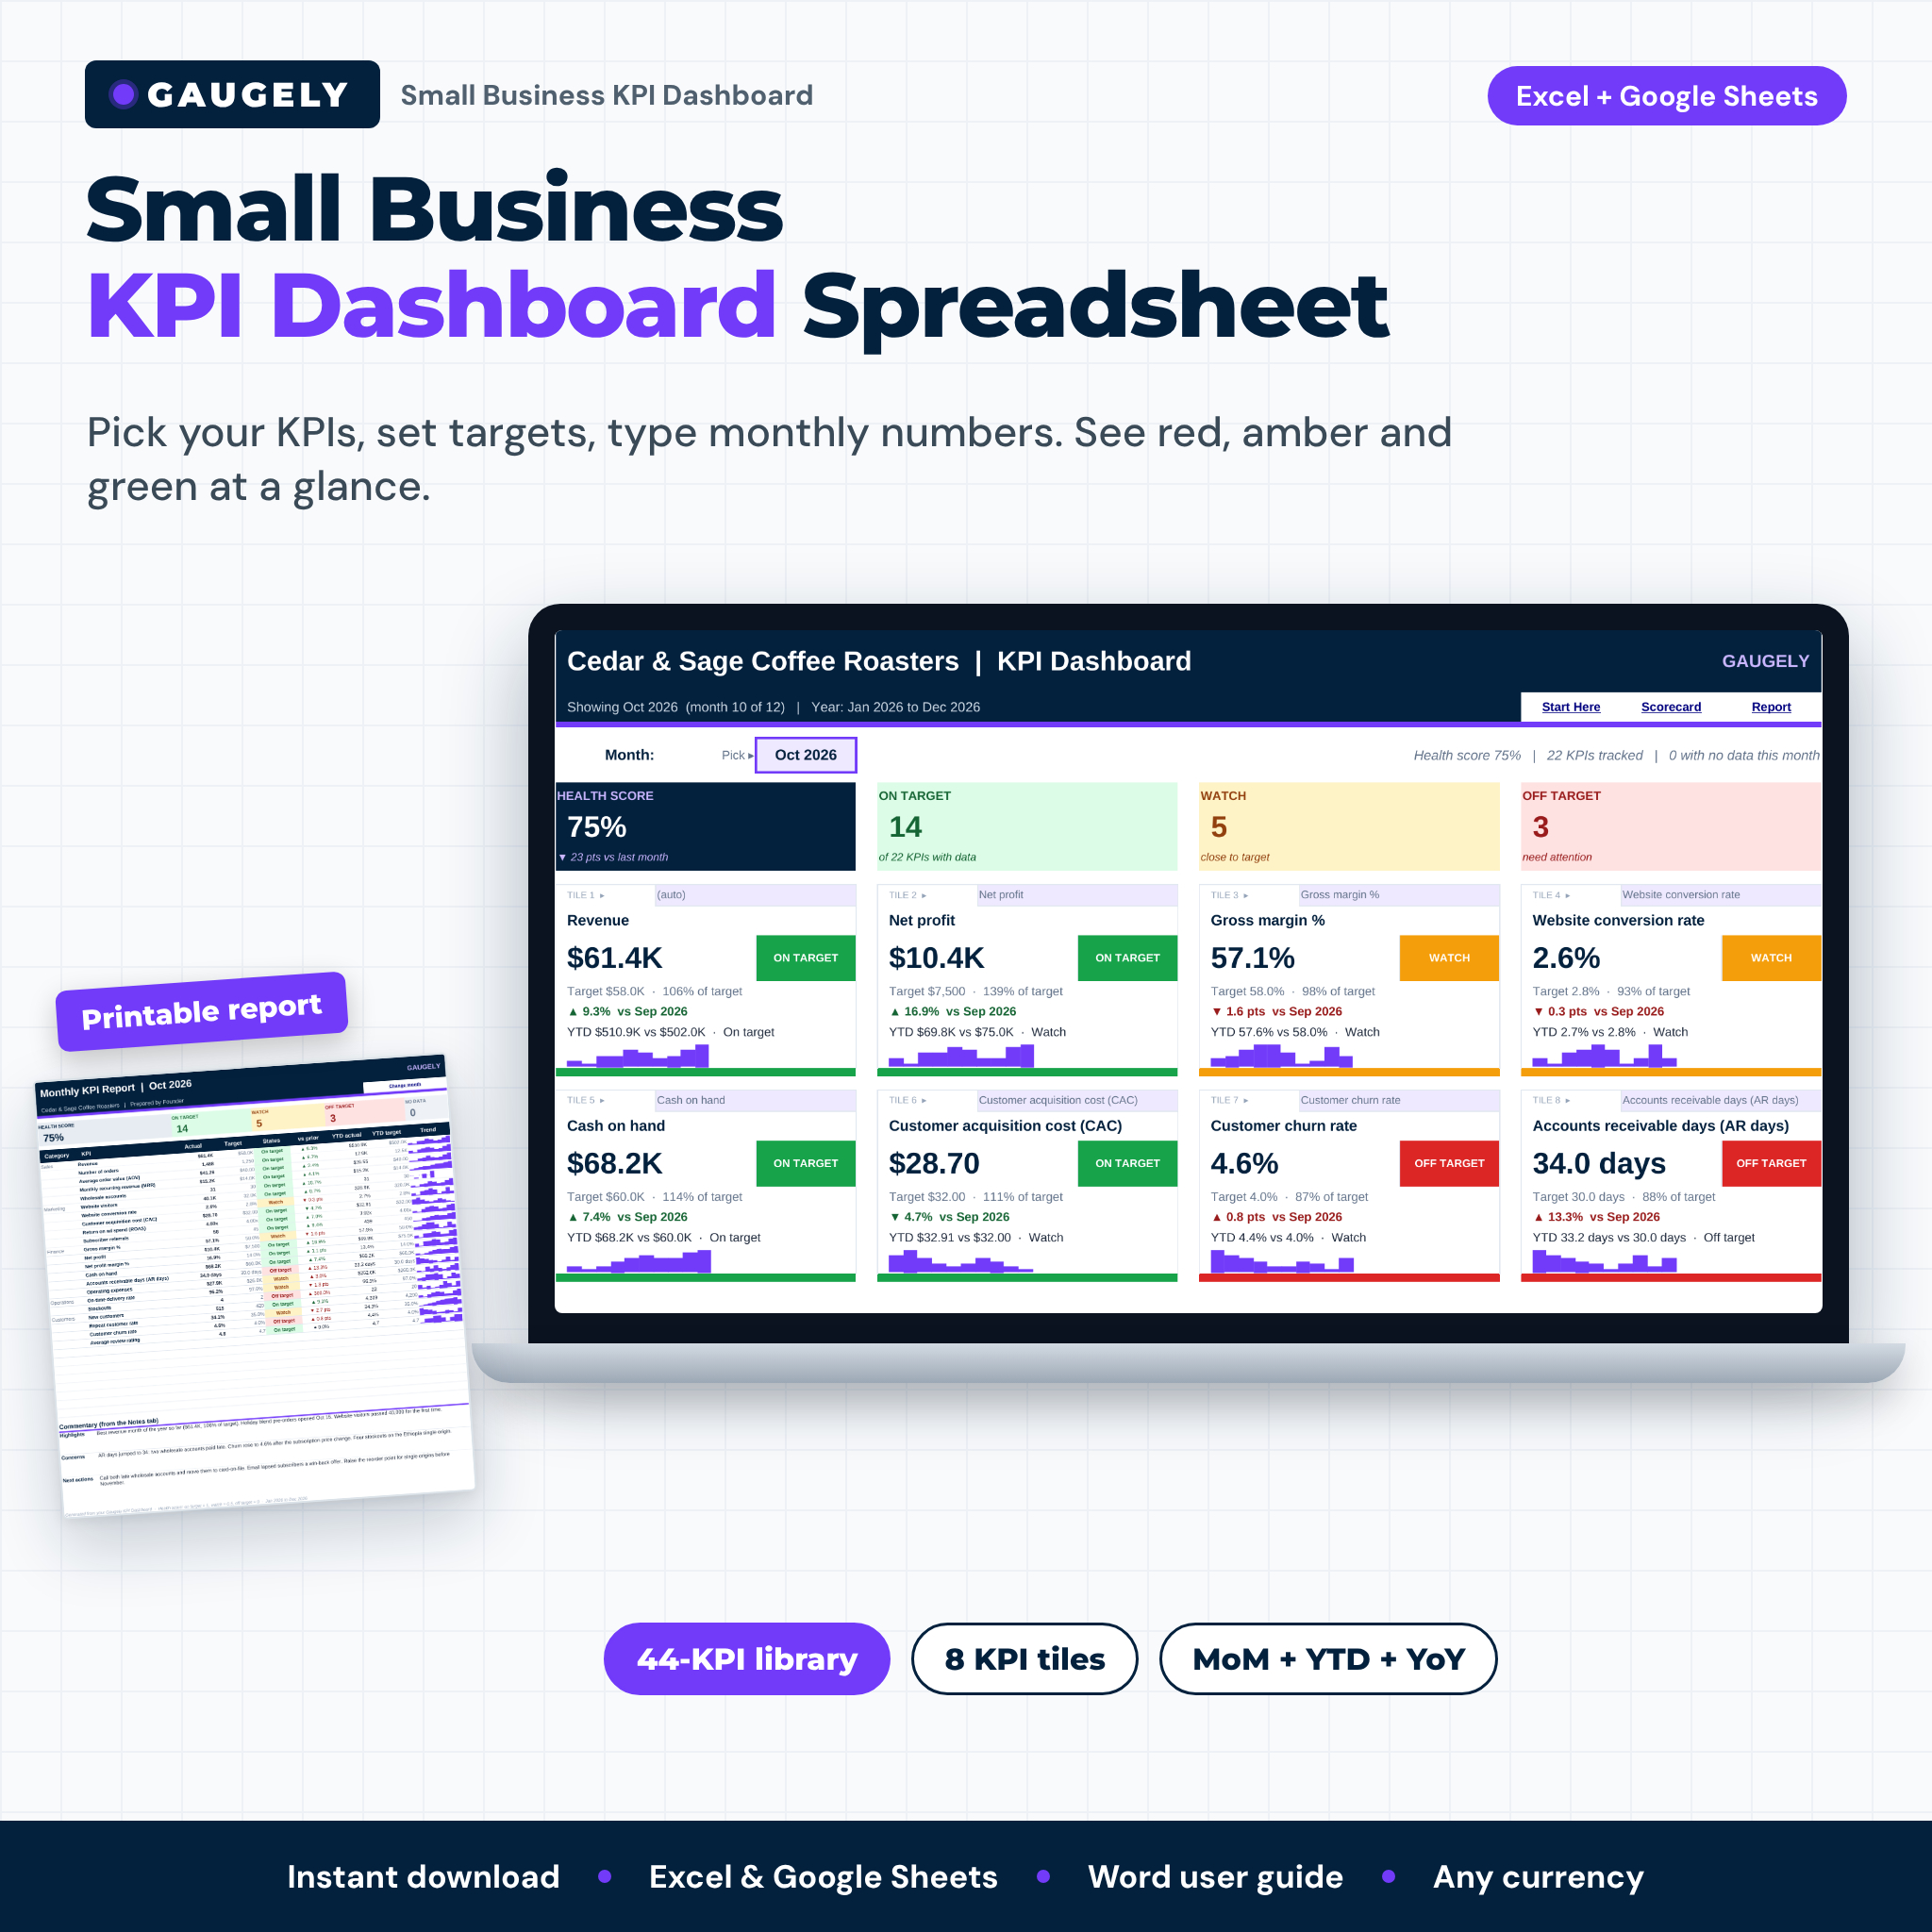
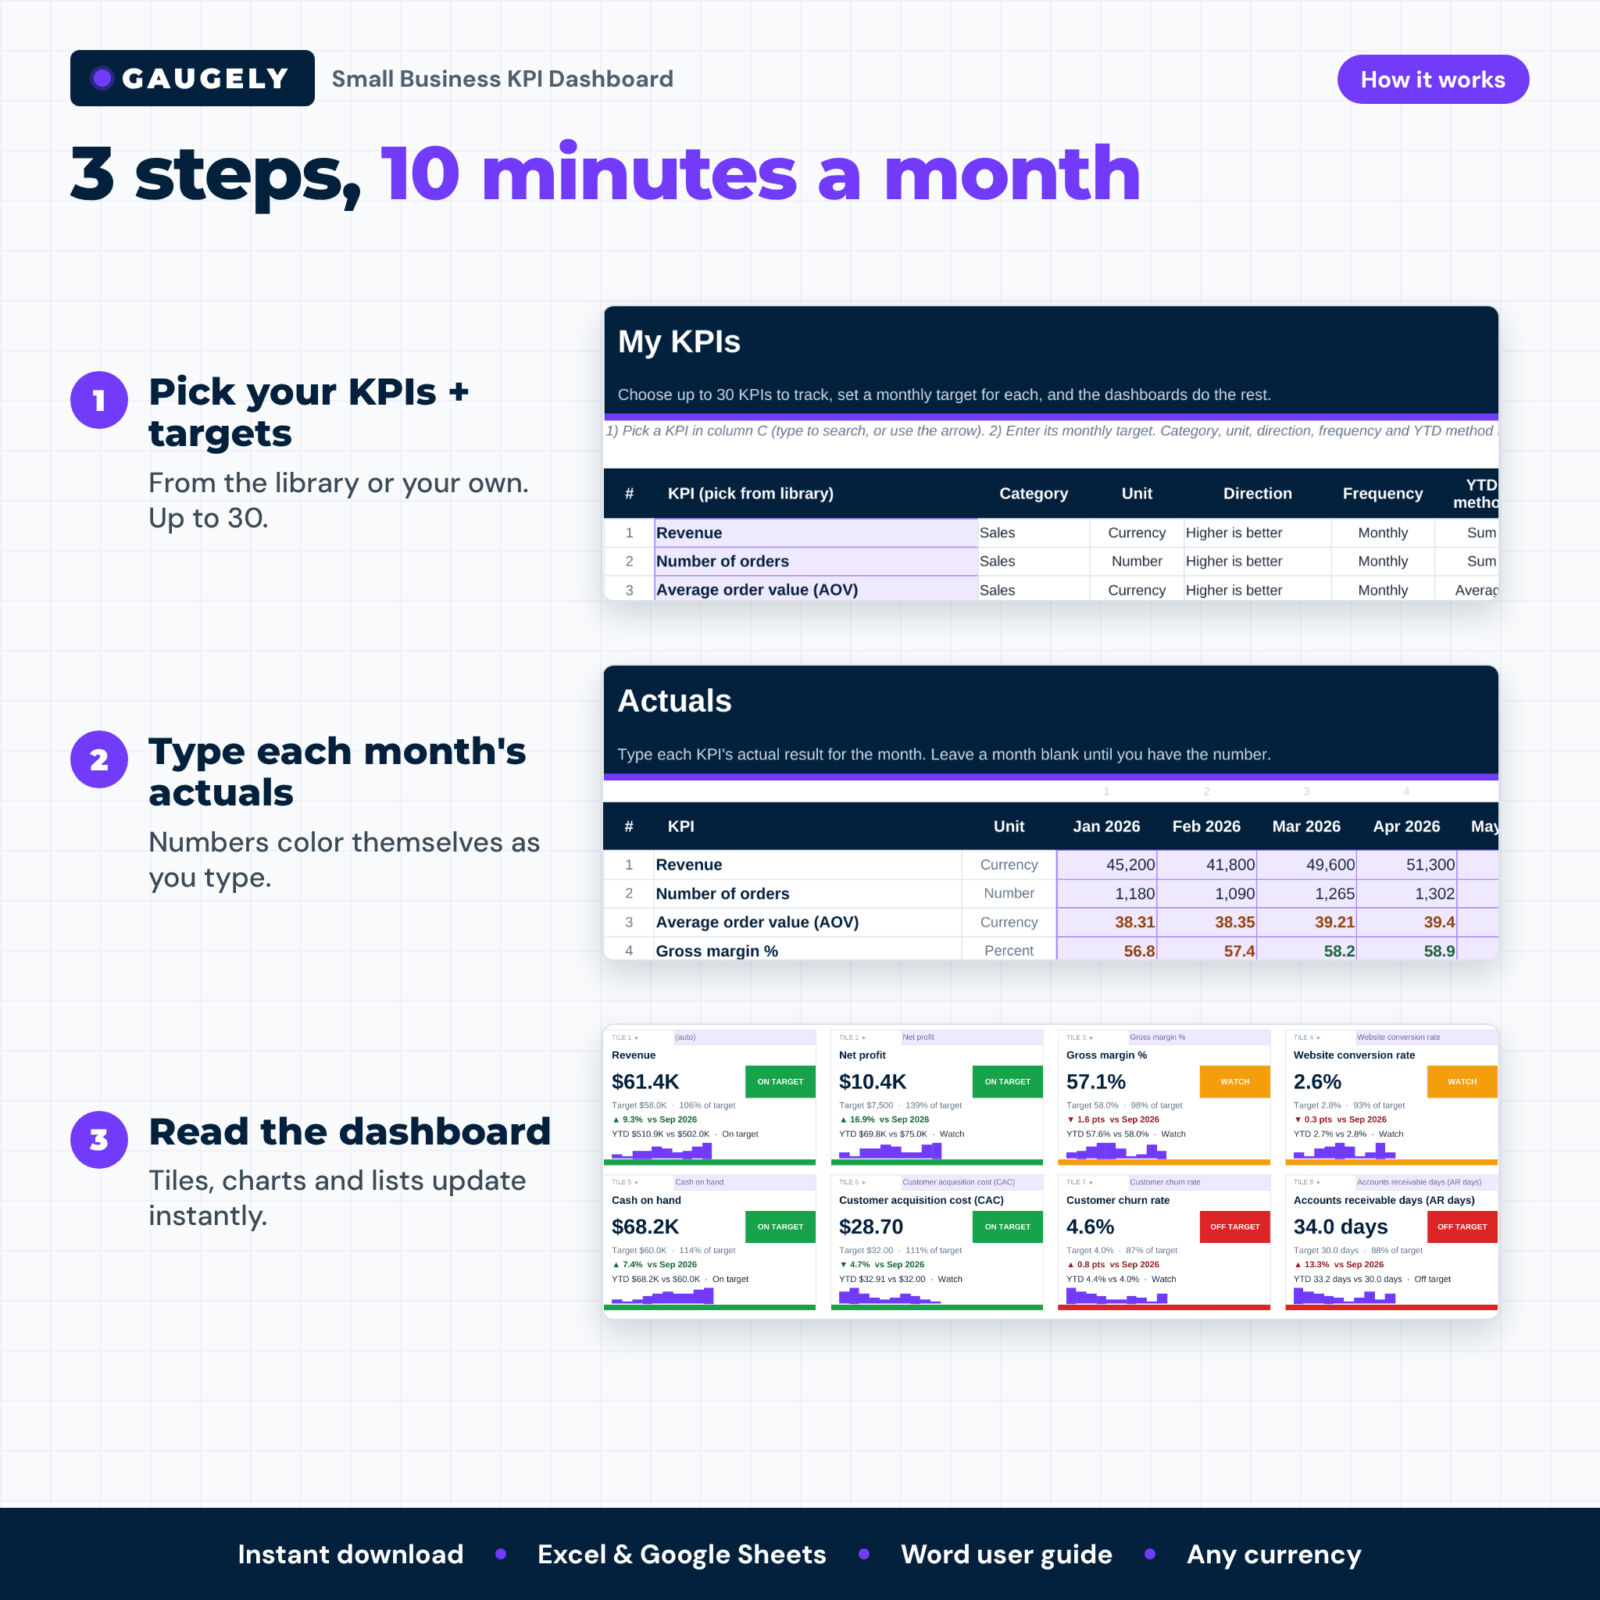
Gaugely is a small business KPI dashboard spreadsheet that shows how your business is really doing in one place. Choose the key performance indicators that matter to you, set a target for each, and type the actual numbers once a month. The workbook colors every KPI green, amber or red, compares it with last month, last year and your year-to-date target, and lays it all out on a one-page dashboard you can read in a minute.
It is made for owners and managers, not data analysts. Every input cell is violet, every formula is locked (with no password), and a step-by-step Word guide walks you through setup in about 10 minutes.
What the KPI dashboard does
- Tracks up to 30 KPIs chosen from a library of 44 common small-business KPIs across sales, marketing, finance, operations, customers and team, plus 12 rows for your own custom KPIs.
- Scores each KPI against target with automatic red / amber / green status. Higher-is-better, lower-is-better (costs, churn, AR days) and closer-to-target KPIs are all handled correctly.
- Compares every month: change vs the prior month, year-to-date actual vs YTD target, and year over year if you add last year’s numbers.
- Shows the trend with sparklines in every tile and table, plus native charts that work in Excel and Google Sheets.
- Prints a one-page monthly report with a health score, the full KPI table and your commentary.
Features
One-page dashboard
- Month selector (or “Latest month” so it always opens on your newest numbers)
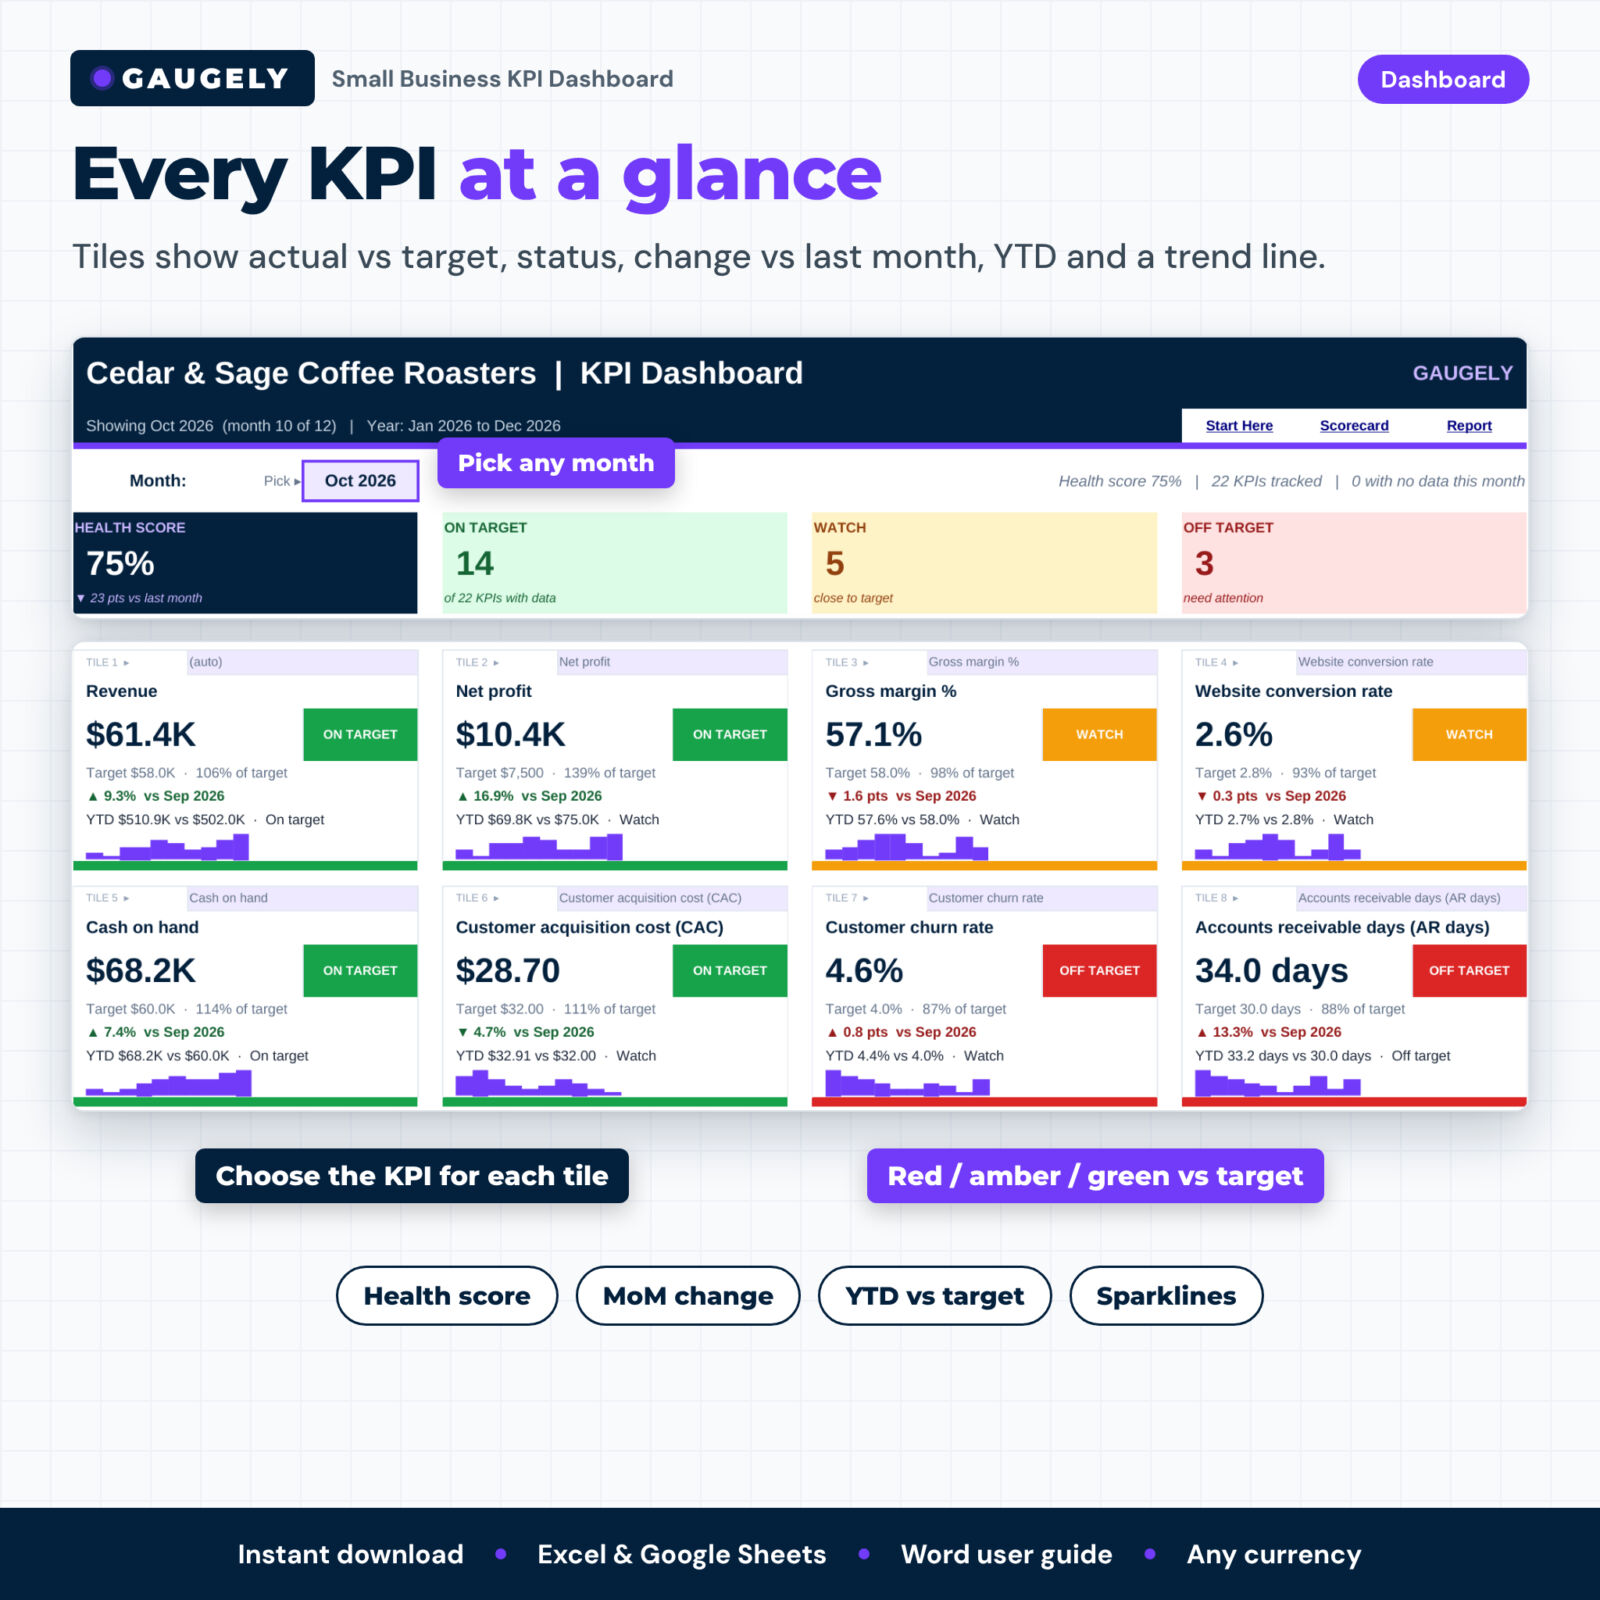
- Health score and on target / watch / off target counts
- 8 KPI tiles: value, status, target, % of target, change vs last month, YTD vs target and a sparkline. Pick which KPI each tile shows.
- KPI health by month chart, featured KPI trend chart (actual vs target vs last year), category summary and a needs-attention list sorted worst first
KPI library and setup
- 44 built-in KPIs including revenue, gross margin %, net profit margin, cash on hand, AR days, customer acquisition cost (CAC), conversion rate, average order value, repeat customer rate, churn, MRR, ROAS, on-time delivery and labor cost %
- Each KPI lists its unit, direction, YTD method, how to calculate it and why it matters
- Set a monthly target, owner, frequency (monthly or quarterly) and your own amber band per KPI
- Optional month-by-month targets for seasonal businesses
Analysis views
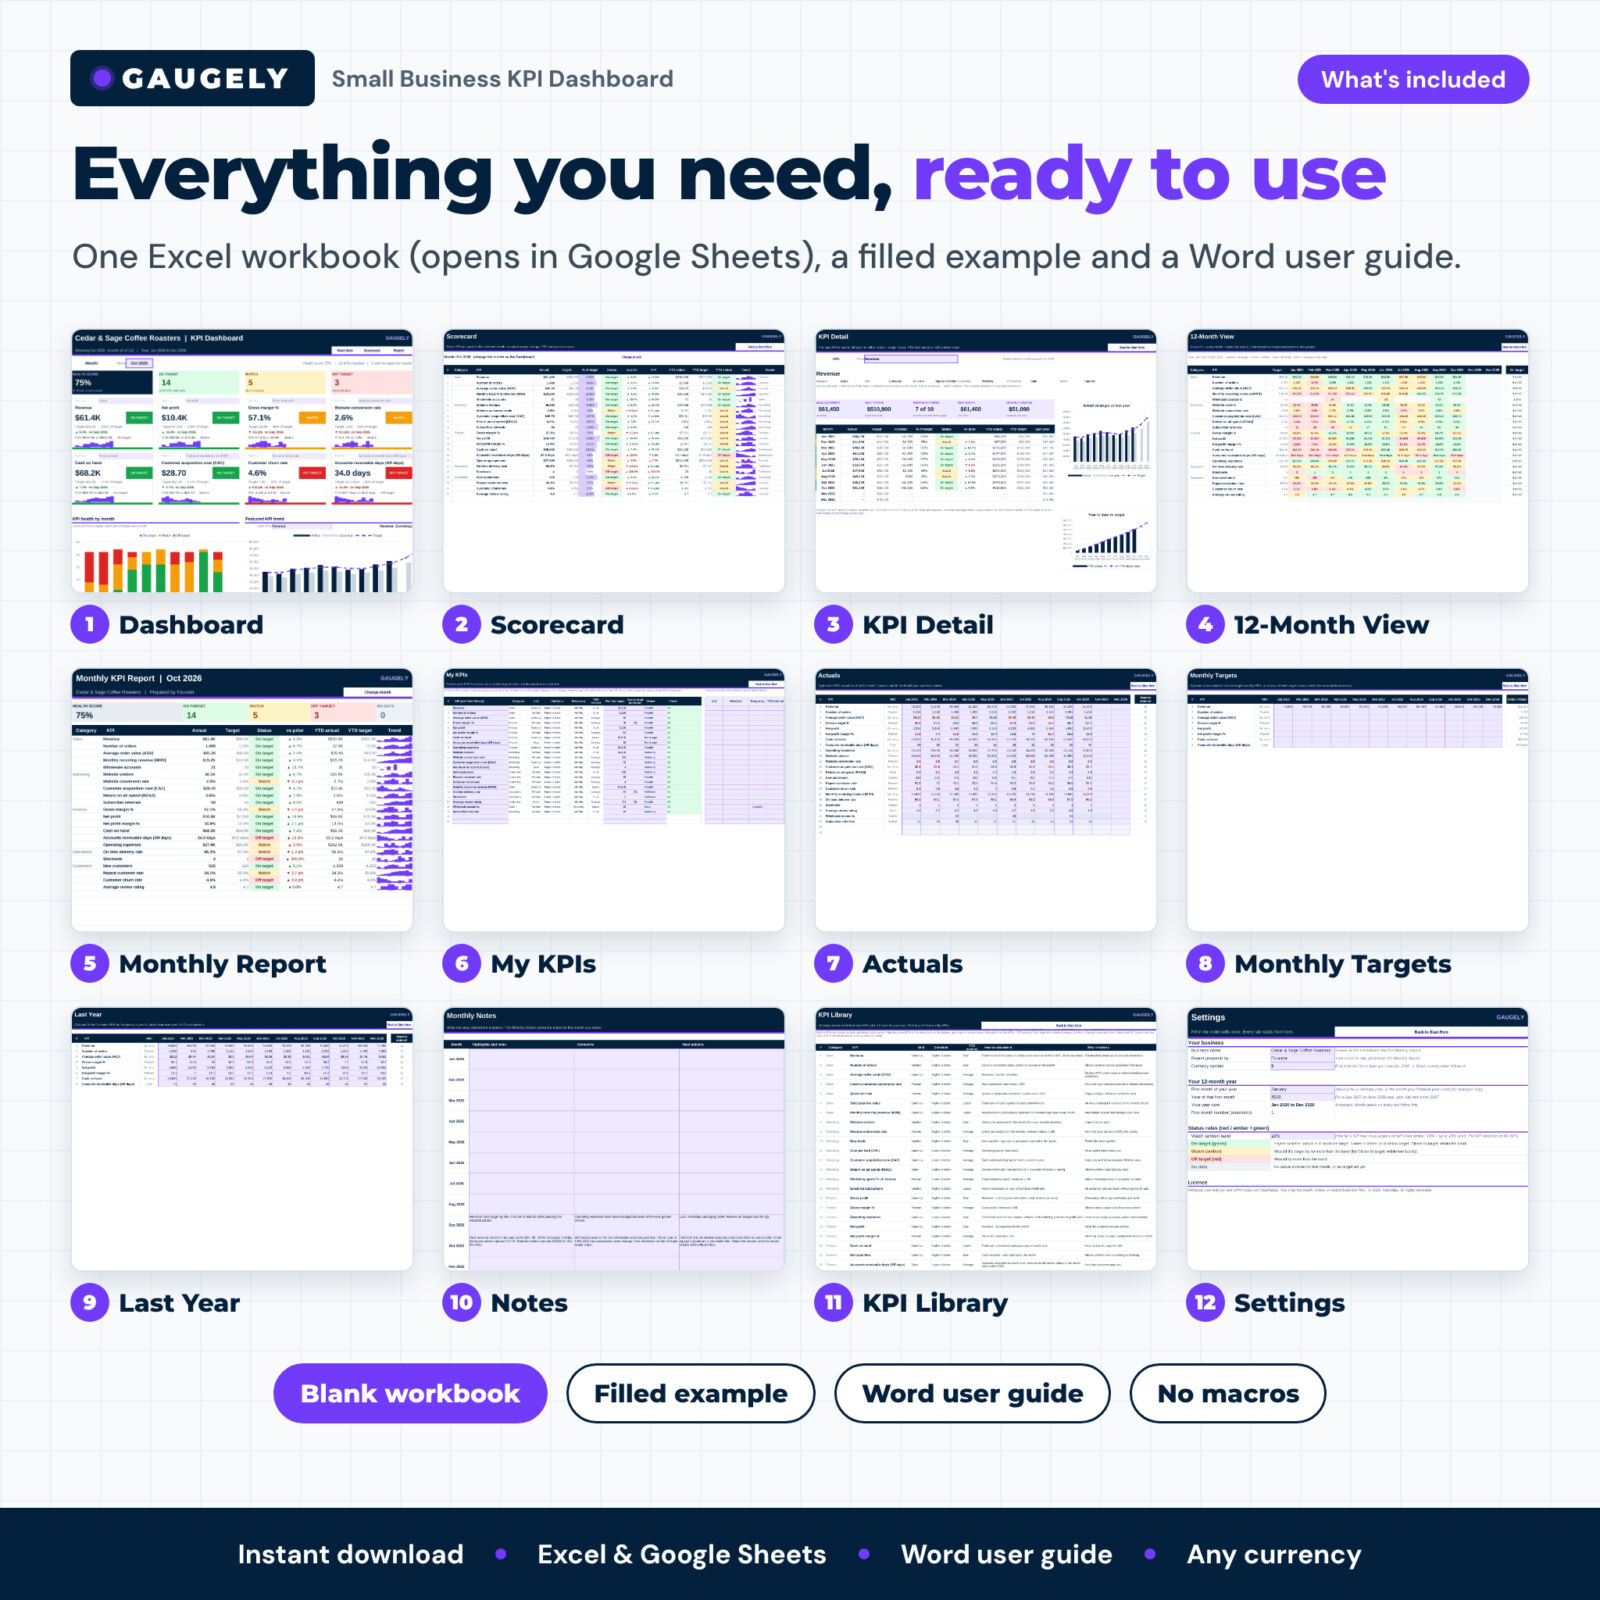
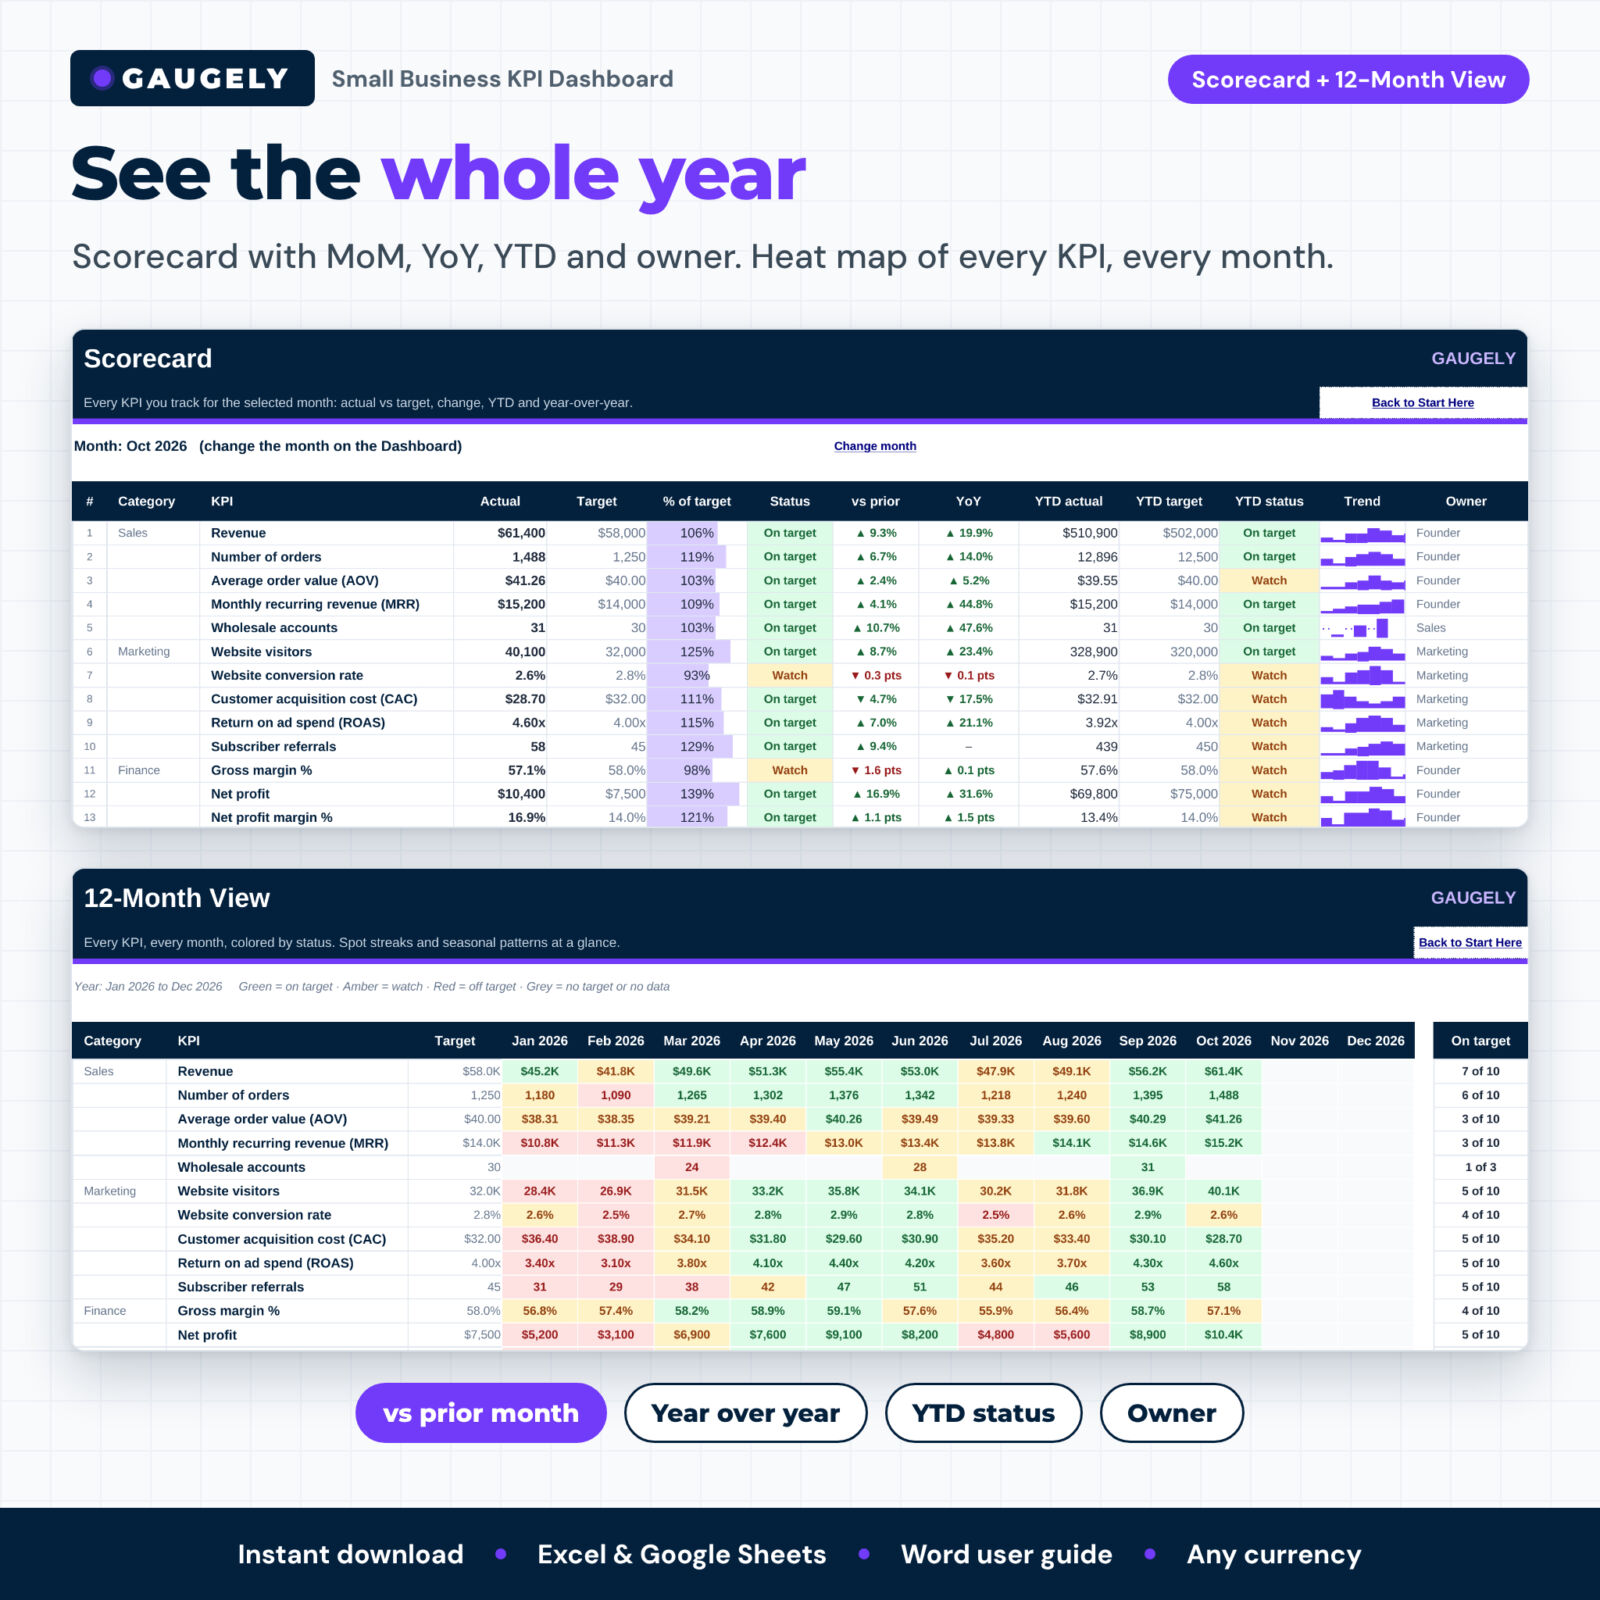
- Scorecard: every KPI with actual, target, % of target, status, MoM, YoY, YTD, YTD status, trend and owner
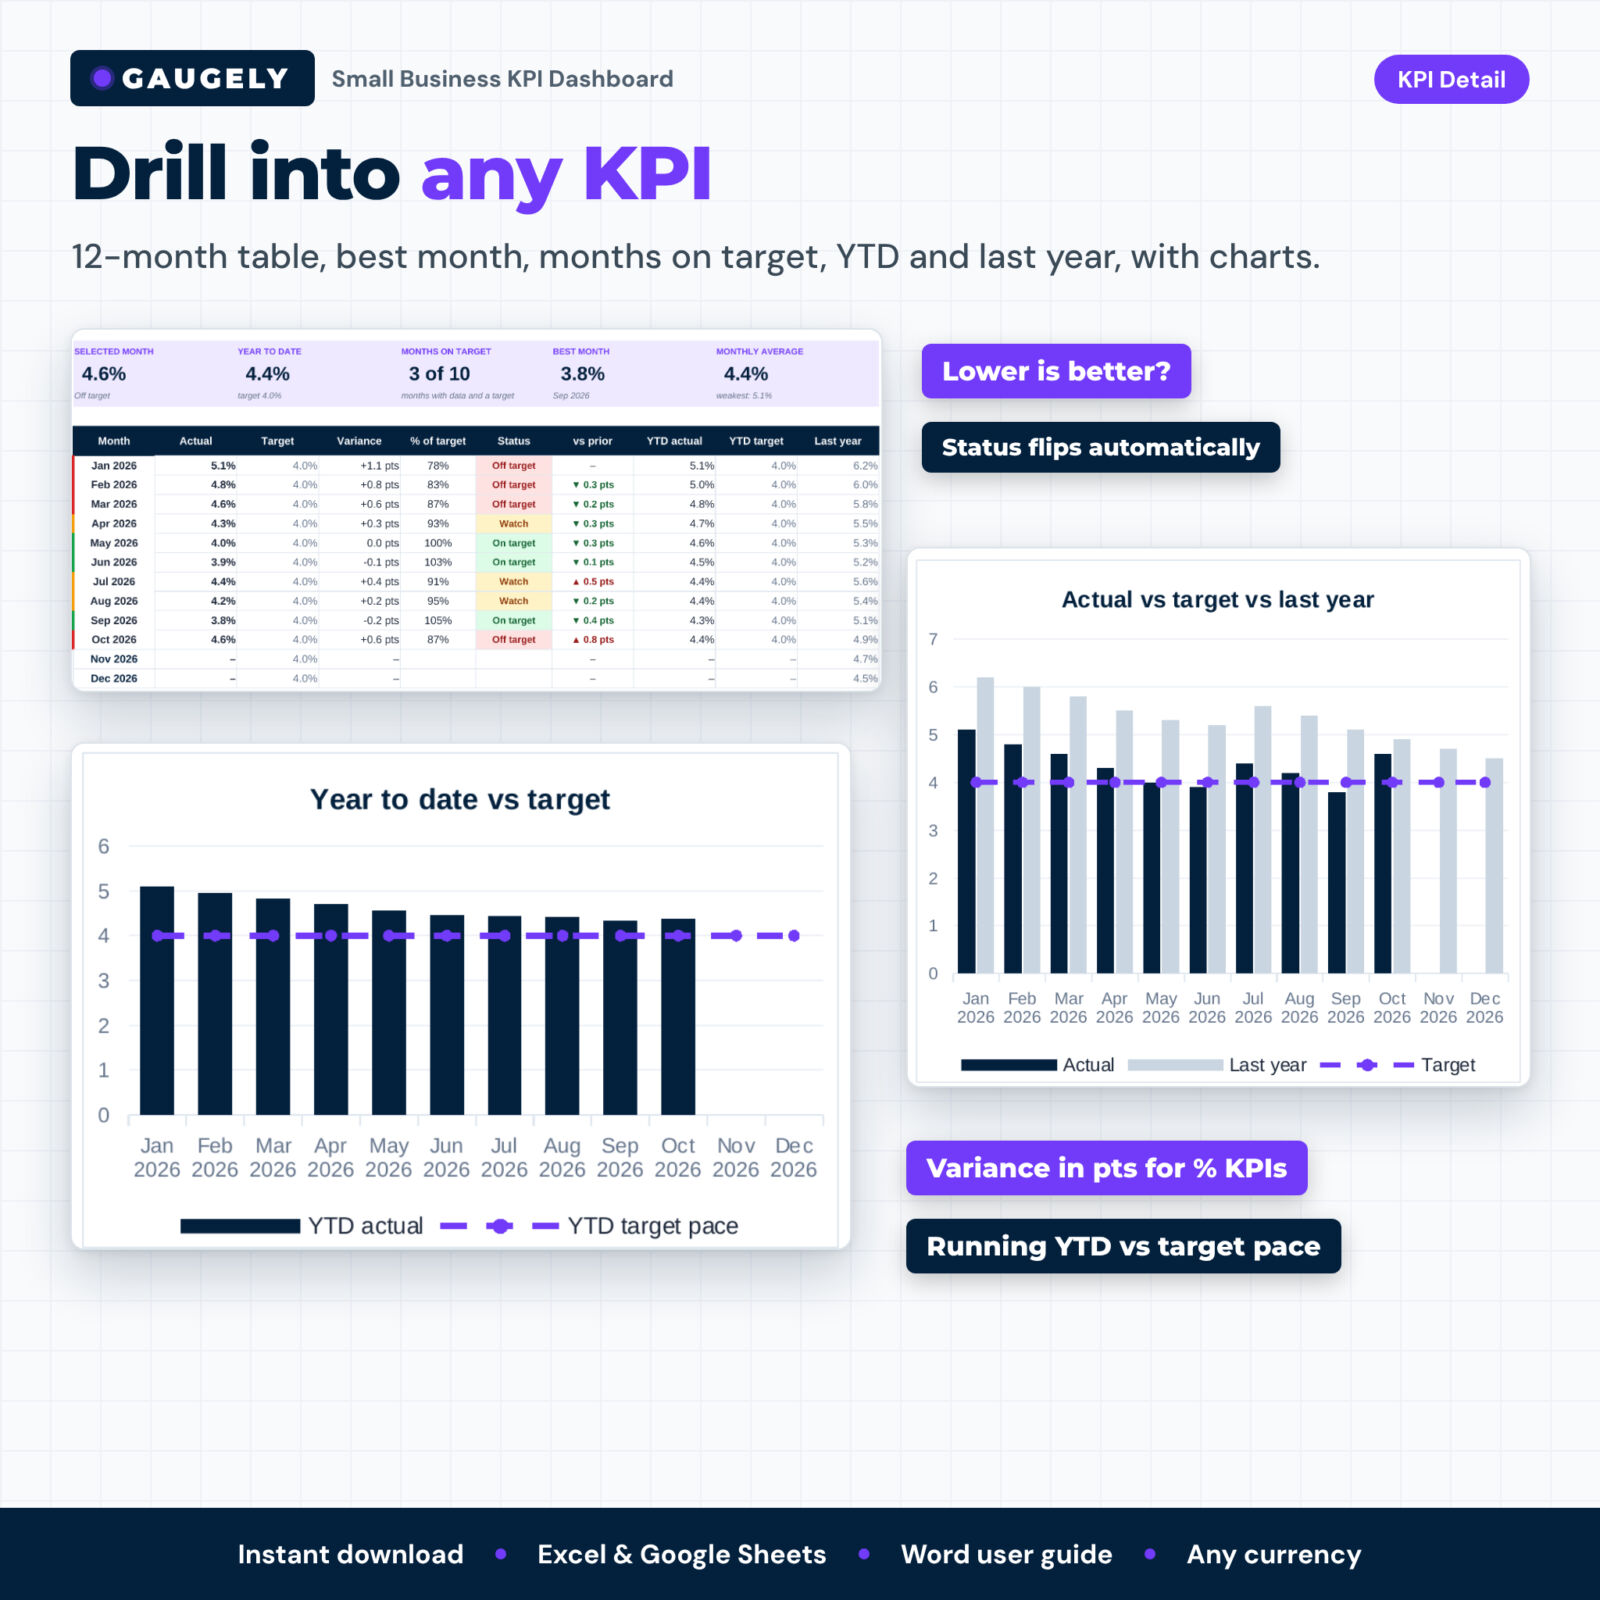
- KPI Detail: 12-month table, best month, months on target, monthly average, actual vs target vs last year chart and a YTD vs target pace chart
- 12-Month View: a heat map of every KPI in every month, colored by status
- Monthly Report: a print-ready portrait page with summary counts, KPI table and your highlights, concerns and next actions
What’s included
- Gaugely Small Business KPI Dashboard (.xlsx): a clean workbook with 13 tabs and a starter set of 12 popular KPIs already picked (no data)
- A filled example workbook for a fictional coffee roaster (22 KPIs, 10 months) so you can see every feature working
- Gaugely User Guide (.docx): setup, every tab explained, how status and YTD are calculated, tips, troubleshooting and FAQ
How it works
- Settings: add your business name, currency symbol and the first month of your year.
- My KPIs: pick your KPIs from the dropdown and type a monthly target for each.
- Actuals: each month, type the results. Numbers color themselves as you type.
- Dashboard: pick the month and read the story. Add notes and print the monthly report.
Who it is for
Owners of shops, online stores, cafes, salons, studios, agencies, trades and service businesses; managers who report to an owner or partners every month; and bookkeepers or consultants who prepare monthly KPI reports for clients.
Real situations where it helps
- A monthly business review: open the dashboard, check the red tiles, write three next actions.
- A seasonal retailer setting higher revenue targets for November and December without false red flags in quiet months.
- A subscription business watching MRR, churn and CAC side by side.
- A service business tracking billable utilization, quote win rate and AR days.
- Preparing a one-page KPI report for a business partner, investor or lender.
File formats and software requirements
- Microsoft Excel 2016 or later (Windows or Mac), Microsoft 365 and Excel for the web
- Google Sheets (free Google account): upload the .xlsx and open it with Google Sheets
- No macros, add-ins, scripts or external links. User guide in Word (.docx) format
Customization
Use any currency symbol, start your year in any month, add up to 12 custom KPIs, override unit, direction, frequency or YTD method for any KPI, and set your own amber band globally or per KPI. Print on US Letter or A4.
Digital download
This is a digital product. You get instant access to the files after purchase; nothing is shipped. Personal use only (or use within your own business). You may not resell, share or redistribute the files.
FAQ
Does this KPI dashboard work in Google Sheets?
Yes. Upload the .xlsx file to Google Drive and open it with Google Sheets. Formulas, dropdowns, colors, sparklines and charts carry over.
How many KPIs can I track?
Up to 30 at a time, chosen from 44 built-in KPIs or up to 12 of your own.
Can I add my own KPIs?
Yes. Type a name, category, unit and direction in a custom row of the KPI Library and it appears in the dropdown.
What if lower numbers are better, like costs or churn?
Each KPI has a direction. Lower-is-better KPIs turn green when they are at or below target, and their arrows are green when they fall.
Does it handle a fiscal year that doesn’t start in January?
Yes. Pick the first month of your year in Settings and every label updates.
Is this the same as an OKR tracker?
No. This tracks recurring business KPIs against monthly targets. OKRs are a separate goal-setting method with objectives and key results.
Do I need to know formulas?
No. You only type in the violet cells. All formulas are locked so they cannot be broken by accident.
Can I print the dashboard?
Yes. The dashboard prints on one landscape page and the monthly report on one portrait page, on US Letter or A4.

Reviews
There are no reviews yet.