Stop Chasing Budget Numbers Across Tabs—and See What Your Money Is Doing
If your budget feels harder to maintain than it should, the problem may not be your spending. Many templates ask you to enter the same figure in several places, leaving you to notice when one tab quietly drifts away from another. This Executive Budget Dashboard Spreadsheet Suite is designed around a simpler principle: enter your spending once, then let the workbook do the joining-up for you.
Everything you spend goes on the Transactions sheet. The other fourteen sheets read from it, so your dashboard, monthly budget, cash flow, bills, savings, debt and net worth figures are built from the same underlying information. For a clearer way to organise the year in Microsoft Excel or Google Sheets, explore the Executive Budget Dashboard Spreadsheet Suite.
When Your Budget Is Technically Complete but Still Does Not Give You a Clear Answer
A budget can contain plenty of figures and still leave you uncertain. You may know what you planned to spend, yet not know whether bills are due soon, whether your cash balance is moving in the right direction, or whether a debt payment is helping your wider financial position.
This is where a connected workbook can make the process easier to follow. Rather than treating your annual plan, daily transactions, savings goals and debts as separate exercises, this template brings them into one system. You enter the information where it belongs, and the relevant summaries update from that shared source.
The aim is not to make financial planning feel more complicated. It is to give you a practical place to review what is happening, spot drift while there is still time to respond, and make decisions with a fuller picture in front of you.
A Single Source of Truth for Your Monthly and Annual Budget
The workbook is structured so the figures can follow through your financial picture without repeated manual entry. That means less copying between tabs and a more consistent way to review the year.
Understand the year at a glance
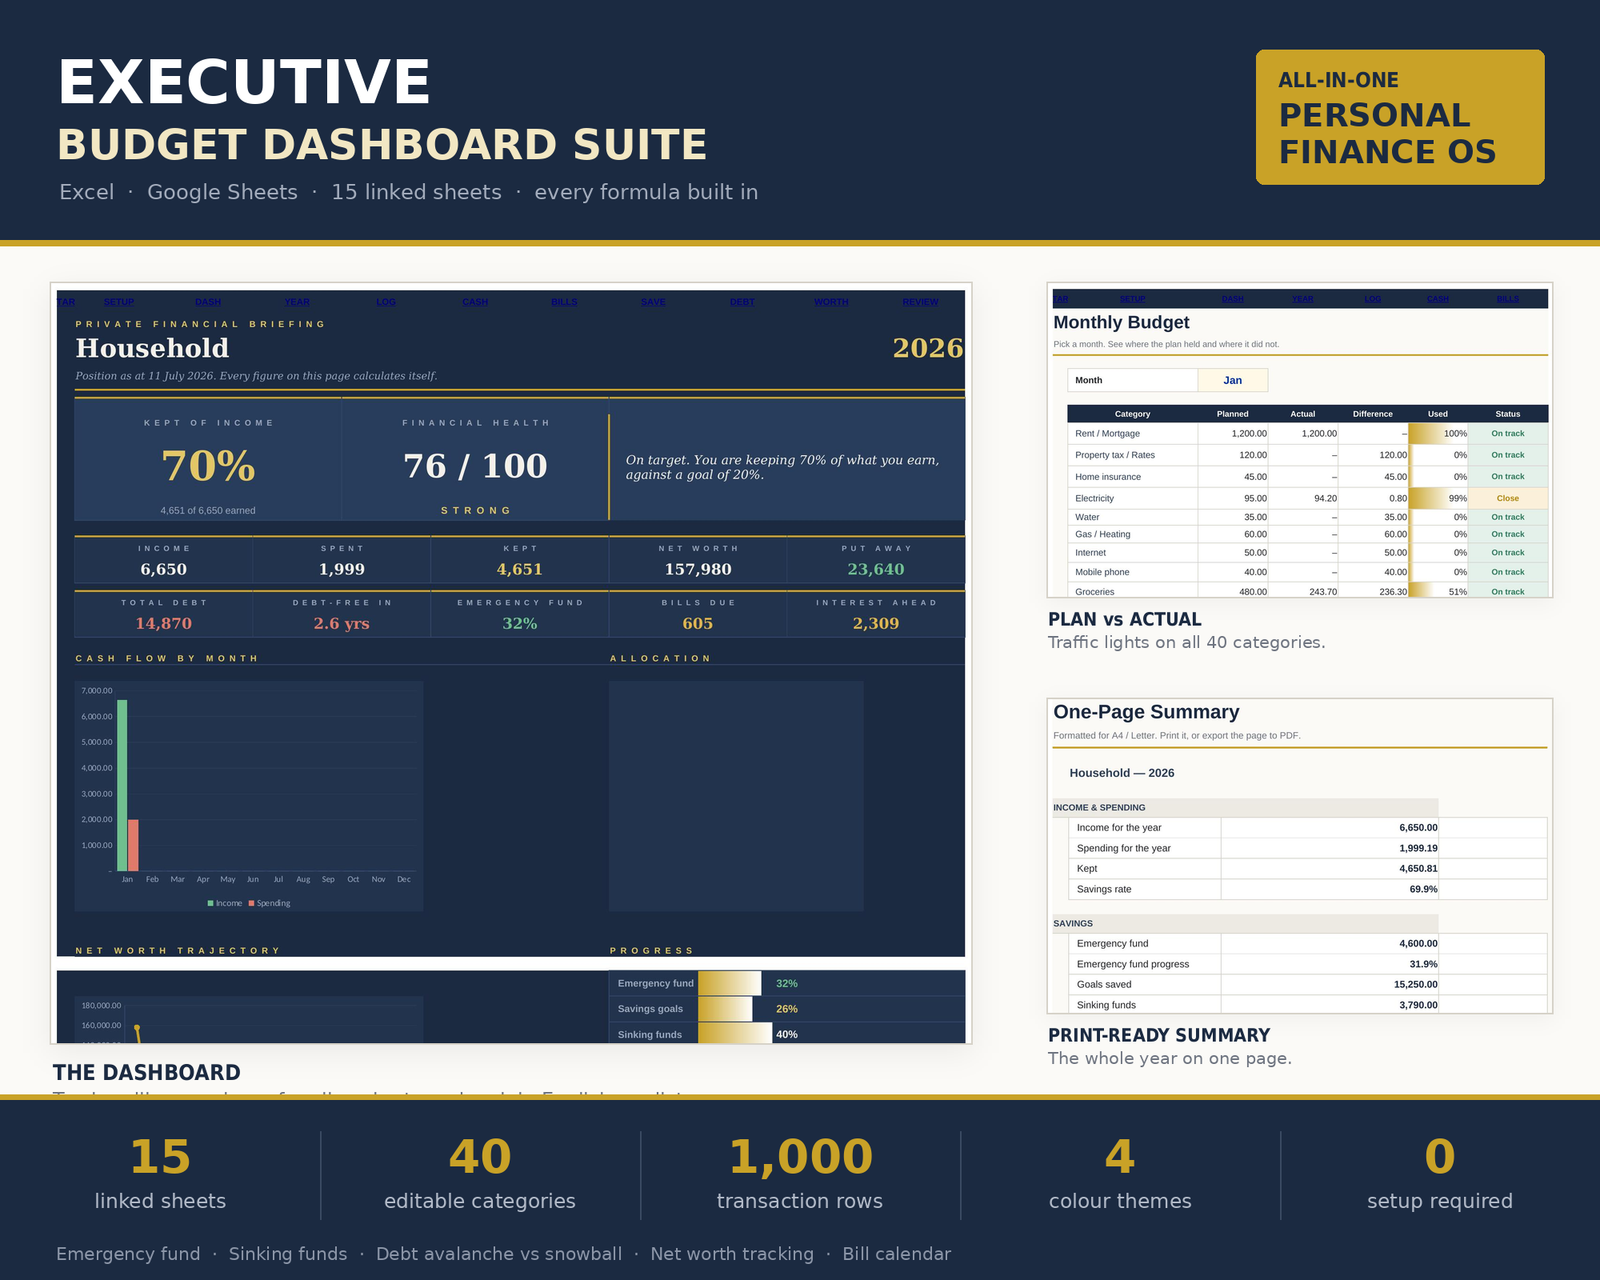
The Dashboard brings together ten headline figures, four live charts and a plain-English verdict on how the year is actually going. It gives you a starting point for a monthly review rather than making you search through separate sheets.
Spot budget drift before the month ends
The Monthly Budget compares plan against actual and uses traffic lights to highlight movement. You can see where spending is drifting while there may still be time to make a practical adjustment.
Keep bills, savings and debts in view
Record due dates and receive an overdue warning on the Dashboard, track an emergency fund alongside twelve goals and fourteen sinking funds, and compare avalanche versus snowball debt approaches using your own balances and rates.
Follow your wider financial position
Cash Flow shows money in, money out, net movement and a running balance month by month. Net Worth tracks assets minus liabilities monthly and charts the change over time.
How the Executive Budget Dashboard Spreadsheet Suite Works
You do not need to maintain multiple versions of the same number. The workbook is designed to guide the information from one main entry point into the summaries that help you review it.
- 1
1. Set your targets
Use the Annual Plan to organise all 40 categories across 12 months in one grid. Your targets pre-fill the Monthly Budget, giving you a planned figure to compare with what actually happens.
- 2
2. Record transactions once
Add income and spending to the Transactions sheet, which provides 1,000 rows and dropdown-driven entry. A red flag highlights a mistyped category so errors are easier to notice.
- 3
3. Review the connected picture
Use the Dashboard, Cash Flow, Bills, Savings, Debt and Net Worth sheets to understand the effect of your entries across the wider plan. Transfers between your own accounts stay out of spending totals.
- 4
4. Check in and adjust
Use the monthly Review sheet and the one-page annual view to reflect on what changed, where the figures moved and what you may want to update next.
Budgeting with One Connected Workbook Versus Managing Separate Templates
The difference is not simply how many sheets a workbook contains. It is whether those sheets are working from the same information, so you can spend less time reconciling figures and more time deciding what they mean.
Repeating figures in several tabs
Separate templates can ask you to type the same amount more than once, creating more opportunities for one version to become outdated.
✓ Enter spending on the Transactions sheet once, while the other sheets read from it.
Reviewing only what has already happened
A historical list of transactions may tell you where money went, but not necessarily what is due next or how your plan is moving.
✓ Bring planned spending, actual spending, bills, cash flow and goals into one review process.
Treating debt repayment as a generic example
A standard illustration may not reflect your balances or interest rates.
✓ Compare avalanche and snowball approaches using the debt information you enter.
Letting account transfers inflate spending
Moving money between your own accounts can make spending totals look higher if it is recorded without context.
✓ Log an internal transfer so it stays out of your spending totals.
Fighting with a workbook that hides its inputs
When every cell looks equally editable, it can be difficult to know where to begin.
✓ Every cell you need to touch is cream, while the remaining calculations are handled by the workbook.
Built to Survive Contact with a Real Person and a Real Month
Financial templates are often judged in ideal conditions, but your actual month may include a changed category, an unexpected bill, a transfer between accounts or a debt recorded in a way that needs to flow correctly through your wider figures.
This workbook lets you rename any category and carries that change through the system. Entering a debt as a negative places it correctly in net worth. You can choose from four colour themes, and the workbook includes a Print Pack that presents the full picture on a single sheet of paper.
For those looking for a practical routine rather than another abandoned spreadsheet, see what is included in the complete budget workbook.
Everything You Need to Plan, Track and Review the Financial Year
The suite includes a broad set of connected sheets, with each one serving a clear role in the budgeting process.
Dashboard
Ten headline figures, four live charts and a plain-English verdict on how the year is progressing.
Annual Plan
All 40 categories across 12 months in one grid, pre-filled from your targets.
Monthly Budget
Plan against actual with traffic lights to show where the month is moving away from your plan.
Transactions
1,000 dropdown-driven rows, with a red flag if a category is mistyped.
Cash Flow
Monthly money in, money out, net movement and running balance.
Bills
Due dates and an overdue warning that surfaces on the Dashboard.
Savings
An emergency fund, twelve goals with deadlines and fourteen sinking funds.
Debt
Avalanche versus snowball calculations based on your balances and rates.
Net Worth
Monthly assets minus liabilities, tracked and charted over time.
Review
A monthly check-in and a one-page view of the whole year.
Print Pack
The full financial picture sized to a single sheet of paper.
User guide
A 14-page illustrated guide covering setup, daily use, customisation and troubleshooting.
Your Figures Stay on Your Machine, Without Add-Ins or Bank Connections
The suite works in Microsoft Excel 2016 or newer and Google Sheets. It also opens in Apple Numbers and LibreOffice. There are no add-ins, no macros, nothing to install and no bank connection required.
That means you can enter your figures manually and keep them in the spreadsheet environment you choose. If privacy and control matter to you, choose the workbook that keeps budgeting on your machine.
Questions to Consider Before You Choose a Budget Spreadsheet
A good budgeting tool should be clear about what it does, what it does not do and what you will need to provide yourself. Here are the practical answers.
Will I need to enter the same spending figure in several places?
No. The Transactions sheet is the main entry point for spending, and the other fourteen sheets read from it.
Can I use this if I do not have Microsoft Excel?
Yes. It works in Google Sheets and also opens in Apple Numbers and LibreOffice. For Microsoft Excel, it is specified for version 2016 or newer.
Does it connect to my bank automatically?
No. There is no bank connection. You enter your figures manually, and the information stays on your machine.
Can I change the categories?
Yes. You can rename any category, and the whole workbook follows the change.
How are transfers between my own accounts handled?
You can log a transfer between your own accounts, and it stays out of your spending totals.
Can it help me compare debt repayment methods?
The Debt sheet compares avalanche and snowball approaches using the balances and rates you enter, rather than a generic example.
Is there guidance for setting up the workbook?
Yes. The purchase includes a 14-page illustrated user guide covering setup, daily use, customisation and troubleshooting.
Is the digital download refundable?
No. Because of the nature of digital files, this item is non-refundable. Please review the compatibility and included features before purchasing.
Is this financial advice or a bank service?
No. It is a spreadsheet tool for organising and reviewing the figures you enter. It does not provide regulated financial advice, connect to your bank or make decisions for you.
Get the Executive Budget Dashboard Spreadsheet Suite for £9.99
You receive the connected spreadsheet suite, its eleven practical workbook areas and the 14-page illustrated user guide as an instant digital download. It is designed for people who want one place to plan, record, review and understand their finances across the year.
Please note that this is a digital product and is non-refundable. Check that your preferred spreadsheet application is compatible before you purchase, then get instant access to the budget dashboard workbook.
Make Your Next Money Review More Useful, More Connected and Easier to Follow
You do not need another collection of disconnected tabs. You need a clear place to enter what happened, compare it with what you planned, and see how bills, savings, debts, cash flow and net worth fit together.
The Executive Budget Dashboard Spreadsheet Suite gives you that structure without macros, add-ins or a bank connection. If it matches the way you want to manage your figures, start using the Executive Budget Dashboard Spreadsheet Suite and bring the year into one connected view.