A list of purchases tells you what you bought. A category total tells you where your month went. That second number is the one that changes behavior, because “I spent $612 on food” lands harder than forty-three separate grocery and takeout lines ever will.
This guide is for anyone who wants a monthly expense tracker in Excel that adds up each category without manual math. You will see how to build a simple one yourself with a single formula, what a real month looks like once the totals appear, the mistakes that quietly wreck those totals, and three ready-made Taskdale workbooks if you would rather skip the setup and start logging tonight.
Quick picks: Excel expense trackers with category totals
| Product | Best for | Price | Link |
|---|---|---|---|
| Penny & Petal Income and Expense Tracker | Households who want dashboards and net worth | $4.99 | View |
| Soft Ledger Budget Planner | People who like paper plus an Excel file | Original price was: $12.99.$8.99Current price is: $8.99. | View |
| Sorbet Books Bookkeeping Spreadsheet | Small businesses and side hustles | $17.00 | View |
| TallyBloom Tax-Ready Bookkeeping | US self-employed people filing Schedule C | Original price was: $19.00.$13.00Current price is: $13.00. | View |
Why category totals beat a long list of receipts
Most people who start tracking expenses stop within a few weeks. The log grows, nothing useful comes out of it, and typing in yet another $4.80 coffee starts to feel pointless. Category totals fix that by giving every entry a place to land.
Picture a couple who log 90 purchases in October. Scrolling the list, nothing jumps out. Then the totals appear: groceries $540, eating out $310, subscriptions $87, kids’ activities $215. Suddenly there is a conversation to have. Eating out is more than half the grocery bill. Nobody remembers signing up for three of the subscriptions.
That is the whole job of a tracker. Not to record. To show. When the totals do the showing, you stop dreading the log and start checking it, sometimes twice a week, because you want to see whether the eating-out number is behaving.
How to build the tracker in Excel, step by step
You need two sheets and one formula. Give yourself 30 minutes the first time. After that, each new month takes about two.
Step 1: Make a Log sheet
Name the first sheet Log. In row 1, type four headings: Date, Category, Amount, Note. Every purchase goes on its own row. Keep the date as a real date (type 11/3/2026, not “Nov 3rd”), or the monthly totals will miss it.
Step 2: Lock the category names with a dropdown
Make a short list of categories on a third sheet called Lists, one per cell in column A. Then select column B on the Log sheet, open Data, choose Data Validation, pick List, and point it at your Lists range. Now every entry uses the exact same spelling. This one step saves more grief than any other, because Excel treats “Groceries” and “Grocery” as two different categories.
Step 3: Build the Summary sheet
On a sheet called Summary, put the first day of the month in cell B1, say 11/1/2026. List your categories down column A starting in A3. In B3, type this formula and fill it down:
=SUMIFS(Log!C:C, Log!B:B, A3, Log!A:A, “>=”&$B$1, Log!A:A, “<“&EDATE($B$1,1))
In plain words: add up the Amount column wherever the category matches this row and the date falls inside the month that starts in B1. Change B1 to 12/1/2026 and the whole sheet shows December. One log, every month, no copying tabs.
Step 4: Add a budget column and a difference column
Column C holds what you planned to spend in each category. Column D is simply =C3-B3. Positive means money left. Negative means you went over. Add conditional formatting so negatives turn red, and you have a working dashboard in four columns.
If you want a fuller walk-through of logs, accounts and month-end checks, our guide on how to do bookkeeping in Excel covers the same ideas for anyone who also earns side income.
A worked month: what the totals reveal
Here is a real-feeling November for a family of four with a take-home income of $5,200. The budget column was set on the 1st. The actual column is the SUMIFS result on the 30th.
| Category | Budget | Actual | Difference |
|---|---|---|---|
| Rent | $1,650 | $1,650 | $0 |
| Utilities | $240 | $268 | -$28 |
| Groceries | $700 | $742 | -$42 |
| Eating out | $180 | $296 | -$116 |
| Transport and fuel | $320 | $281 | $39 |
| Kids | $250 | $230 | $20 |
| Subscriptions | $45 | $87 | -$42 |
| Savings transfer | $600 | $600 | $0 |
Total over budget: about $169. But look at where. Eating out alone is $116 over, and subscriptions nearly doubled. Groceries ran a little high too, which often happens in a month when more meals are bought out, because the food at home still gets bought and then wasted.
The fix for December writes itself. Cancel two subscriptions, set a firm $200 cap on takeout and check that one line every Sunday. No guilt spiral, no new app. Just one number to watch. That small, clear target is why category totals work.
Choosing categories you will still use in March
Too many categories and logging becomes a chore. Too few and the totals say nothing. For most households, 12 to 15 is the sweet spot.
- Split the categories you want to change. If takeout is the problem, keep it apart from groceries. If it is not, merge them into Food.
- Merge the ones you cannot change. Water, power and internet can live together as Utilities unless one is creeping up.
- Give savings and debt their own rows. They are not spending, but they leave your account, and you want to see them happen.
- Keep one Misc row, and watch it. If Misc tops 5% of spending, something in it deserves its own category.
Sinking funds are worth a line too. Car registration, birthdays and school trips arrive every year, yet they still catch people out. A small monthly amount set aside for each turns a $400 surprise into a planned withdrawal.
If you would rather start with categories, dashboards and charts already wired up, a ready-made workbook saves the build entirely.

Penny & Petal Income and Expense Tracker
Price: $4.99 | Best for: households wanting dashboards without bank logins
An Excel and Google Sheets workbook with 12 connected tabs. You type each income and expense once, and the monthly dashboard, budget tab, account balances and net worth all update together. Card payments and savings moves go on a separate Transfers tab, so they never double-count as spending. Start by entering your accounts and budget amounts, then log one week of purchases to see the category charts fill in.
Paper first, spreadsheet second
Some people think better with a pen. They plan the month on paper, carry a page in their bag and only open a laptop once a week. That is a perfectly good system, as long as the totals still get added up somewhere.
A hybrid setup works like this. On the 1st, you write the plan on a printed budget page. During the month, you note purchases on a daily log page. On Sunday evening, you type that week’s lines into Excel and let the category totals refresh. Fifteen minutes, a cup of tea, done.
The benefit is attention. Writing “$38 pizza” by hand makes you feel it in a way a bank feed never does. The spreadsheet then does the part paper is bad at, which is adding thirty lines per category without a calculator.
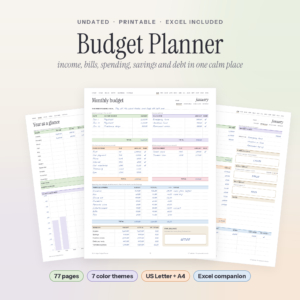
Soft Ledger Budget Planner
Price: Original price was: $12.99.$8.99Current price is: $8.99. | Best for: pen-and-paper planners who still want totals
77 undated printable pages in seven color themes, in US Letter and A4, plus an Excel budget spreadsheet with a dashboard, 12 month tabs, a transactions log, debt payoff and savings goals. Each month has a budget page, an overview with a weekly spending number, a daily log and a review page. Print the first month’s four pages, fill in your plan, then type your weekly purchases into the Excel file to get category totals.
When some of your spending belongs to a business
Side income changes things. If you sell candles on weekends or freelance three evenings a week, mixing business costs into the household tracker muddies both. Your grocery total looks fine, but the $180 of wax and jars hiding in Misc makes the home budget look worse than it is, and the business look better.
Keep two logs. One for the household, one for the business. The business log needs a few extra columns: whether a receipt is saved, which account paid, and sometimes the tax portion. Come tax season, you will be glad every business expense already sits in its own category with a yearly total.
For a small shop or service business, a bookkeeping workbook built for that job gives you category totals plus profit and loss, which a home tracker does not.
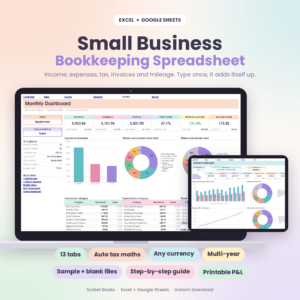
Sorbet Books Bookkeeping Spreadsheet
Price: $17.00 | Best for: makers, freelancers and small service businesses
A 13-tab bookkeeping workbook for Excel 2010 or newer and Google Sheets. It has room for 20 income categories and 30 expense categories, 1,500 rows each for income and expenses, a budget planner with traffic-light colors, invoices, mileage, a tax summary and a print-ready profit and loss statement. It comes as a filled sample file plus a blank one, with a 23-page guide. Open the sample first, then fill in Setup with your currency and categories.
US sole traders who file a Schedule C may prefer TallyBloom from the table above, since its expense categories already point to the matching IRS lines and it includes a quarterly tax planner.
Mistakes that quietly throw your totals off
A tracker is only as honest as its inputs. These five errors cause most of the strange numbers people see.
- Counting a card payment as spending. You already logged the purchases. Paying the card is a transfer. Log it twice and your month looks $900 worse than it was.
- Dates stored as text. If a date sits on the left edge of its cell, Excel may be reading it as words. SUMIFS will skip it. Re-type it or use Text to Columns to convert.
- Typing categories freehand. “Gas”, “gas ” with a trailing space and “Fuel” all split the same spending three ways. Use the dropdown.
- Ignoring refunds. Return a $60 jacket and enter -60 under Clothing. Otherwise the category stays inflated all month.
- Logging cash in one lump. A $200 ATM withdrawal marked Cash tells you nothing. Either split it when you spend it, or treat cash as an envelope with its own budget.
Fix these and the totals start to feel trustworthy, which is what keeps you coming back to them.
A ten-minute weekly routine
Daily logging sounds virtuous and rarely lasts. Weekly works for most people. Pick a fixed slot, like Sunday after dinner or Monday on the train, and keep it short.
- Open your banking app and the tracker side by side.
- Enter every transaction since last week. Use the dropdown for each category.
- Glance at the Summary sheet. Look only at the difference column.
- Pick the one category most at risk and decide a limit for the rest of the month.
- Close the file. That is it.
On the last weekend of the month, add five more minutes. Copy your actual totals into a yearly table and note one thing that went well. After three months you will have a real picture of where money goes in your home, and it feels good to see eating out shrink from $296 to $190 because of choices you made.
For more ideas on keeping a household plan going past the first few weeks, see our family budget planner habits. Planning something big, like a wedding? The same category approach applies, and our wedding budget breakdown shows typical category splits.
Frequently asked questions
How do I get Excel to total expenses by category automatically?
Use SUMIFS. Point it at your amount column, your category column and the category name you want, and add two date conditions to limit it to one month. Fill the formula down a list of categories and every total updates as you log.
Should I use a pivot table instead of formulas?
A pivot table works well for a one-off look back at a year. For a tracker you check every week, SUMIFS is easier because the totals refresh on their own, and you can put the budget right next to them.
How many expense categories should a monthly tracker have?
Between 12 and 15 suits most households. Split out any category you are trying to cut, and merge the ones you cannot change.
Can I use one Excel file for the whole year?
Yes. Keep a single log of every transaction and let the Summary sheet filter by month using the date in one cell. Changing that cell switches the whole view, so there is no need for 12 copies of the same tab.
Does an expense tracker template work in Google Sheets too?
SUMIFS and EDATE work the same way in Google Sheets. Of the Taskdale picks above, Penny & Petal, Sorbet Books and TallyBloom are built for both Excel and Google Sheets.
Your next step
Tonight, pull last month’s transactions from your bank app and sort them into 12 categories, even roughly. Seeing one real month of totals is the moment tracking starts to make sense. If you would rather have the dashboards ready the minute you download, start with the Penny & Petal Income and Expense Tracker and log this week’s spending first.