Home Affordability Spreadsheet and Mortgage Offer Dashboard
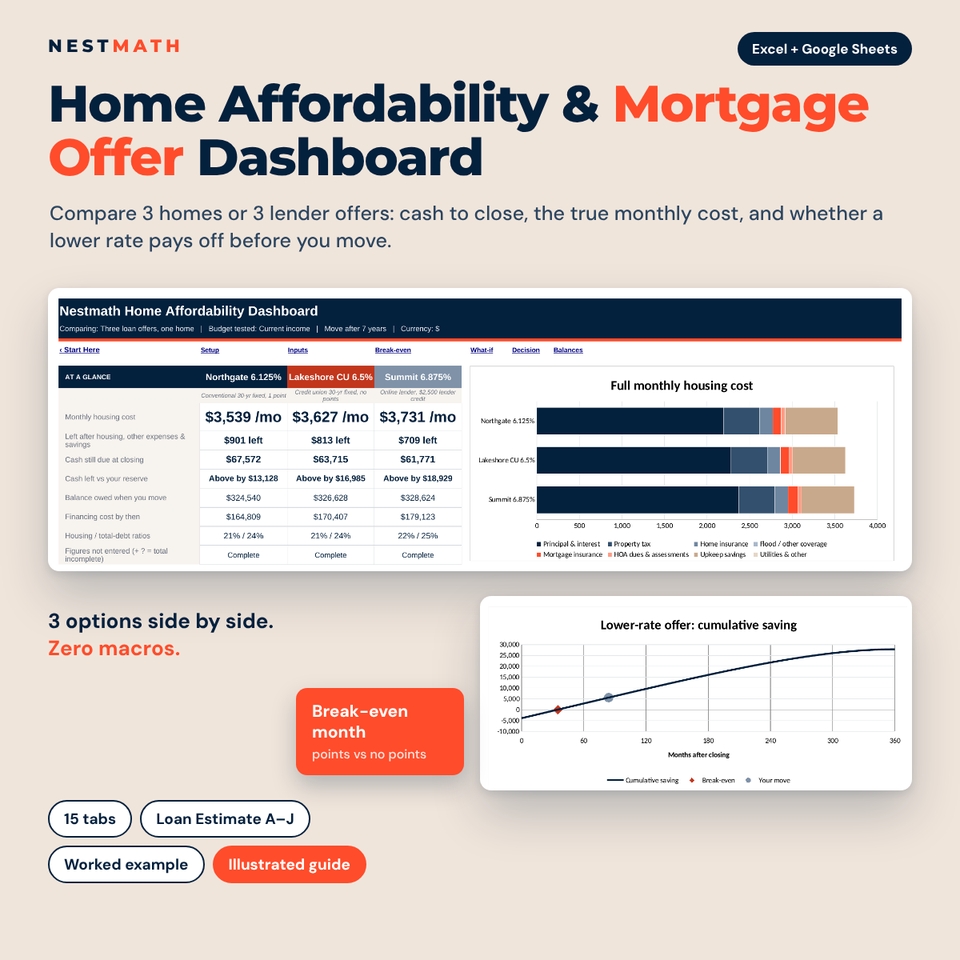
A lower mortgage rate can look like the better deal until you see what it costs to get it. Nestmath is a home affordability spreadsheet and mortgage offer comparison workbook that keeps three questions apart: how much cash you still need at closing, what you will really pay each month, and whether paying more upfront for a lower rate saves money before the year you expect to move. Compare three homes using the same loan terms, or keep the home the same and compare three lenders’ offers line by line.
It is a premium Excel workbook (.xlsx) with 15 tabs, a spectacular dashboard and no macros. It opens in Microsoft Excel 2016 or later, Microsoft 365 and Google Sheets.
Who it is for
- First-time buyers who want to know how much house they can afford before shortlisting homes
- Couples choosing between two or three homes with different prices, taxes and HOA dues
- Anyone holding several Loan Estimates who wants to know if paying points is worth it
- Buyers close to retirement who want to test a purchase against their retirement income too
What makes this mortgage comparison spreadsheet different
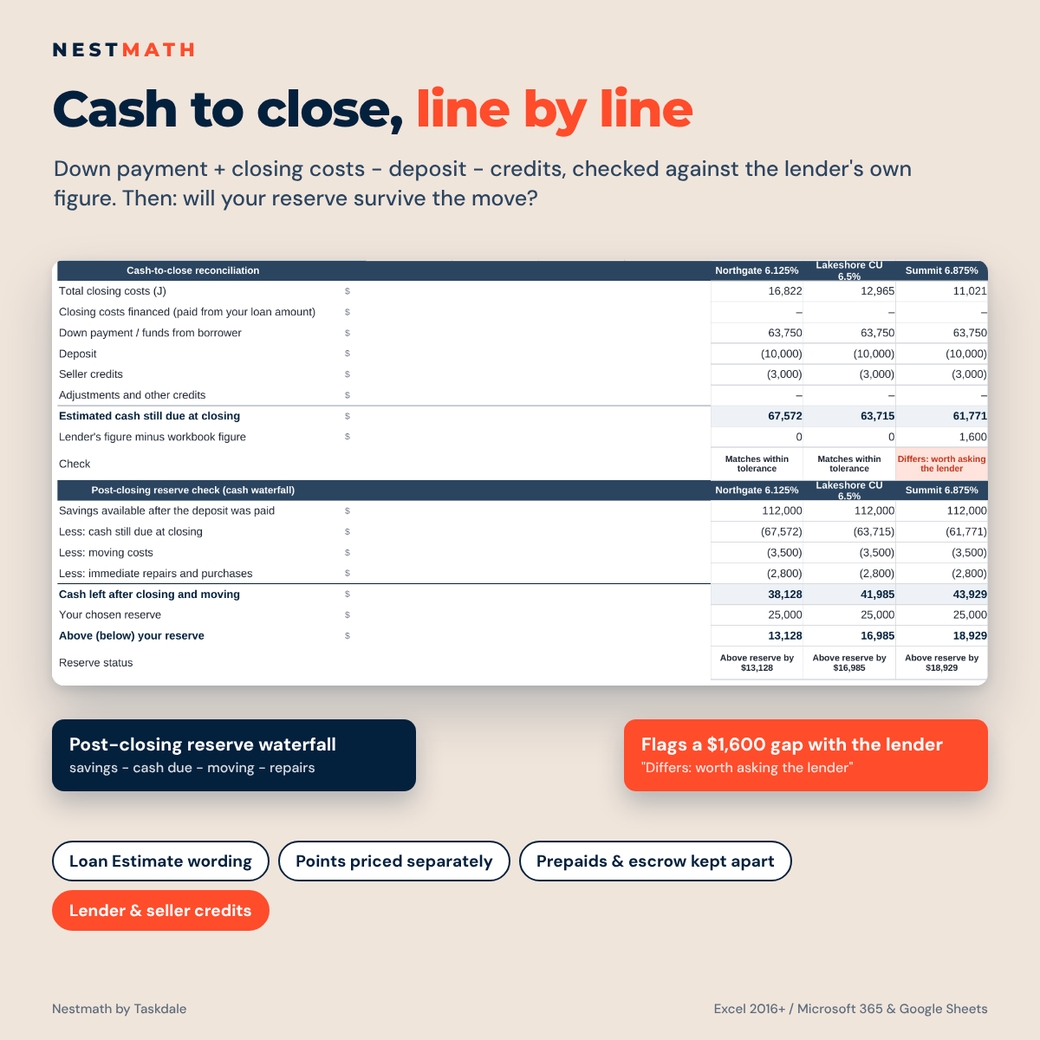
Cash to close, line by line
The cost sheet follows the official US Loan Estimate: origination charges (A), services you cannot and can shop for (B, C), taxes and government fees (E), prepaids (F), initial escrow (G), other costs (H) and lender credits (J). Discount points are priced separately from the lender’s own fees, so you can see the price of a lower rate. The cash-to-close reconciliation deducts your earnest-money deposit and seller credits, then compares the result with the lender’s own figure and flags any gap worth asking about.
The full monthly cost of owning
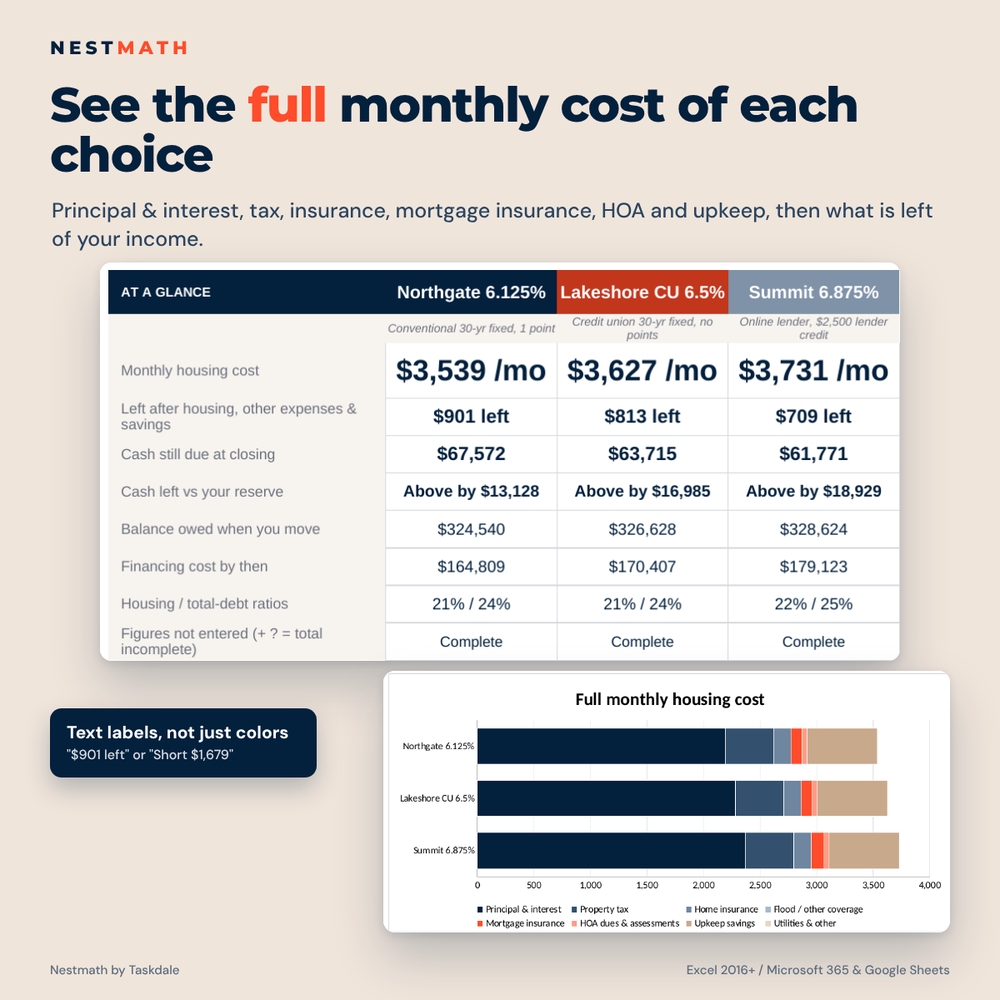
Principal and interest sit beside property tax, homeowners and flood insurance, mortgage insurance, HOA dues, special assessments, utilities and an upkeep allowance. A payment-method switch separates bills paid through escrow from bills you pay directly. Mortgage insurance only ends in the month you enter; the workbook never assumes it disappears on its own.
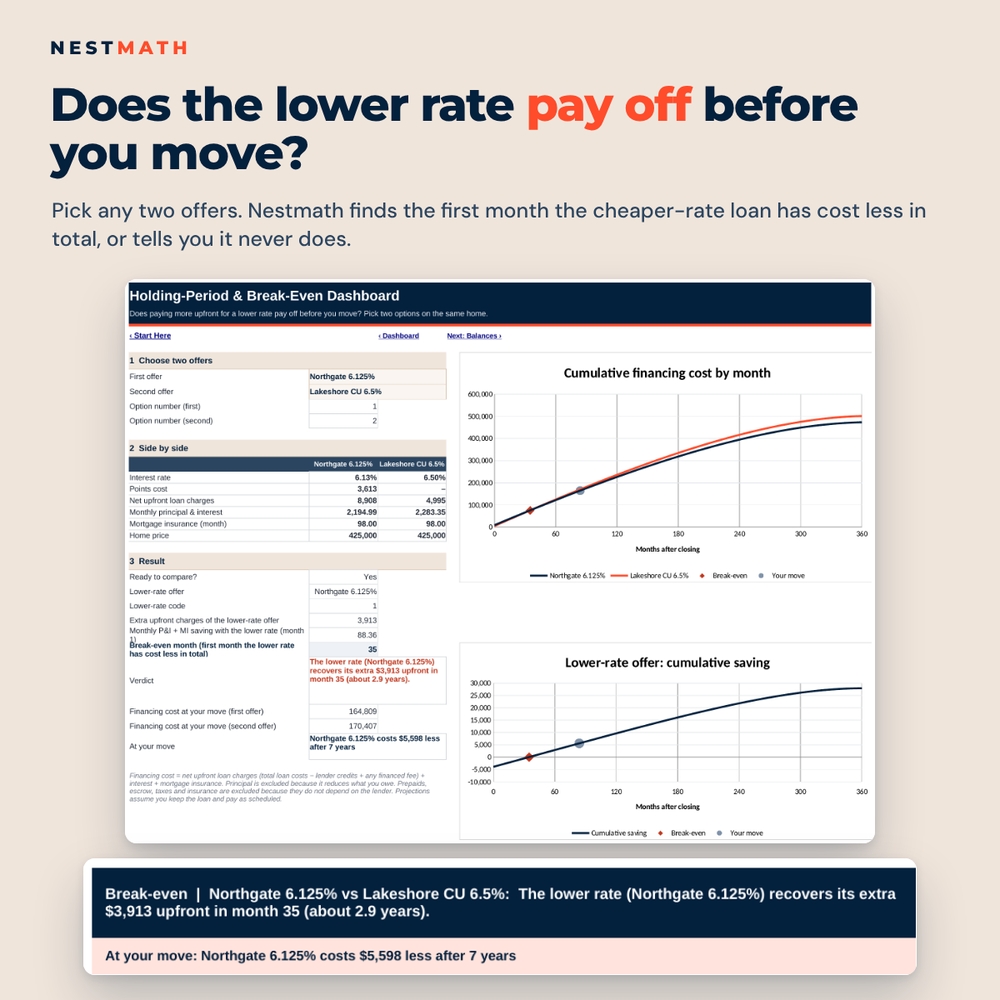
Does the lower rate pay off before you move?
Pick any two offers on the Break-Even dashboard. Nestmath counts net upfront loan charges, interest and mortgage insurance month by month (principal is excluded because it reduces what you owe), finds the first month the lower-rate offer has cost less in total and marks it on a chart. If the lines never cross within your comparison period, it says so plainly.
Honest numbers
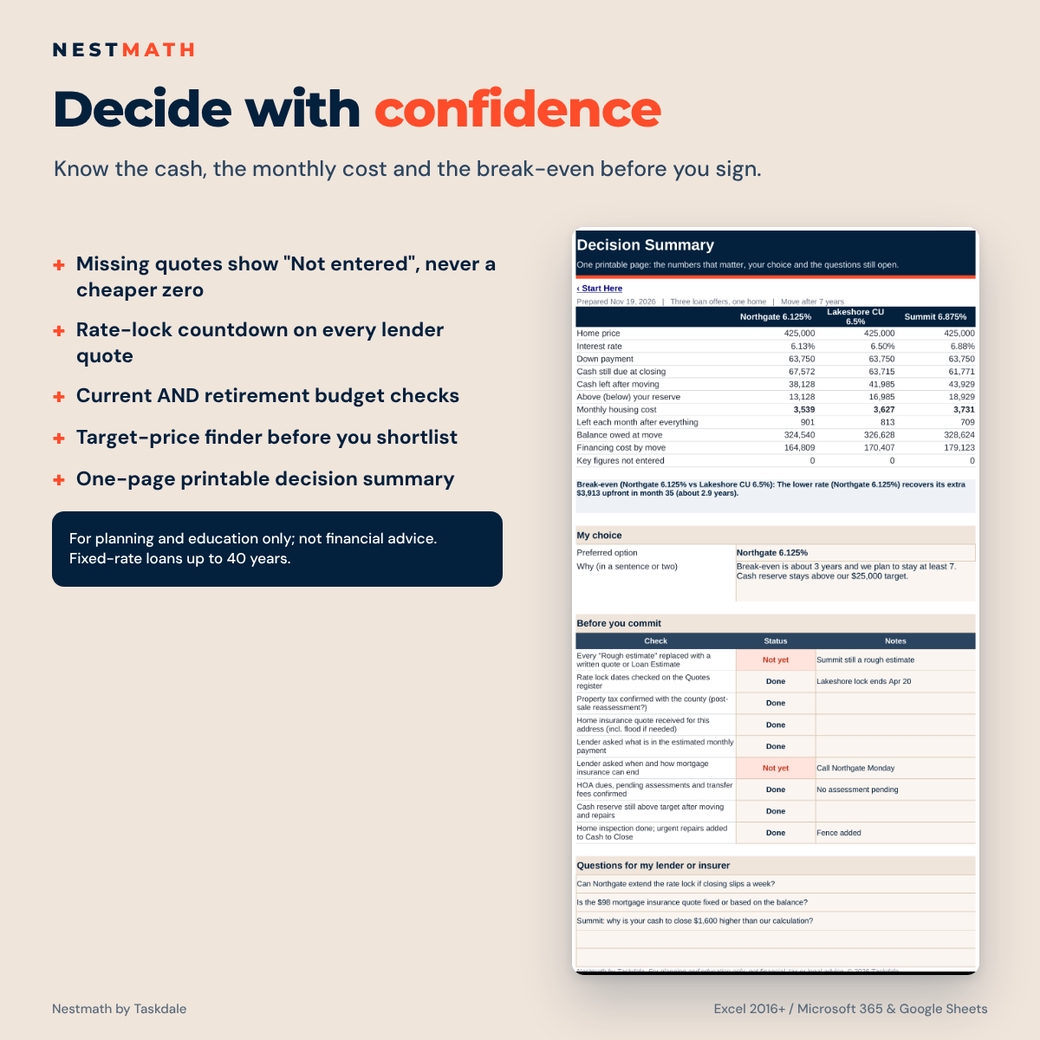
Missing quotes show “Not entered” rather than zero, and an incomplete monthly total is marked “+ ?”, so an unfinished quote never looks like the cheaper offer. Every color has a text label beside it.
Features
- Dashboard: at-a-glance cards for each option, a stacked monthly-cost chart, a “where your savings go” chart and a break-even chart
- Three-option comparison: shared assumptions plus per-option overrides, highlighted automatically
- Household worksheet: take-home income now and in retirement, expenses, savings target, cash reserve and lender-style ratios
- Target-price finder: the highest price your monthly budget and your cash each support, and which one limits you
- Down-payment calculator: dollar amount or percentage, loan-to-value and share of your cash used
- Points and lender-fee worksheet plus a prepaids and escrow schedule
- Post-closing reserve check: savings, minus cash due, moving costs and immediate repairs, compared with your reserve
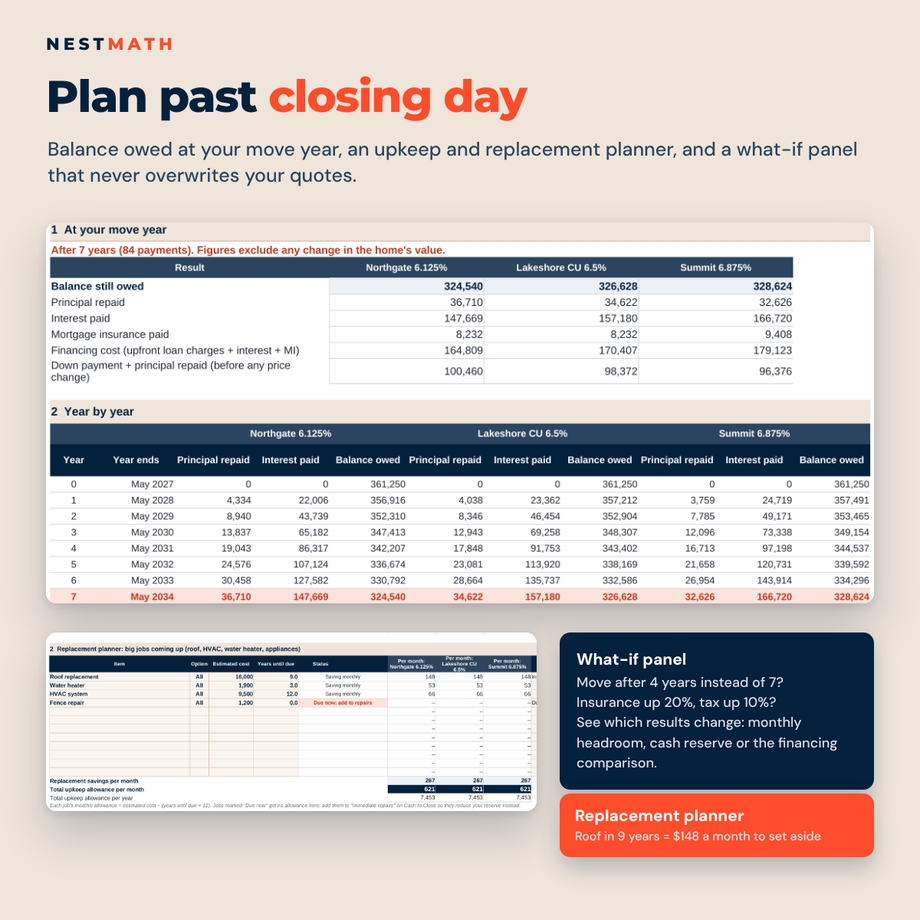
- Upkeep and replacement planner: roof, HVAC or water heater costs turned into a monthly allowance
- Quote register: source, date, status and expiry for 30 figures, with a rate-lock countdown
- Move-year balance table: principal repaid, interest paid and balance owed, year by year for all three options
- What-if panel: earlier move, higher premiums, tax increase, bigger upkeep allowance or an income change, without overwriting your quotes
- Printable decision summary: one page with the key numbers, your choice, a checklist and questions for your lender
- Full amortization schedules for all three options (up to 40-year terms)
- One currency setting ($ by default) used by every money label
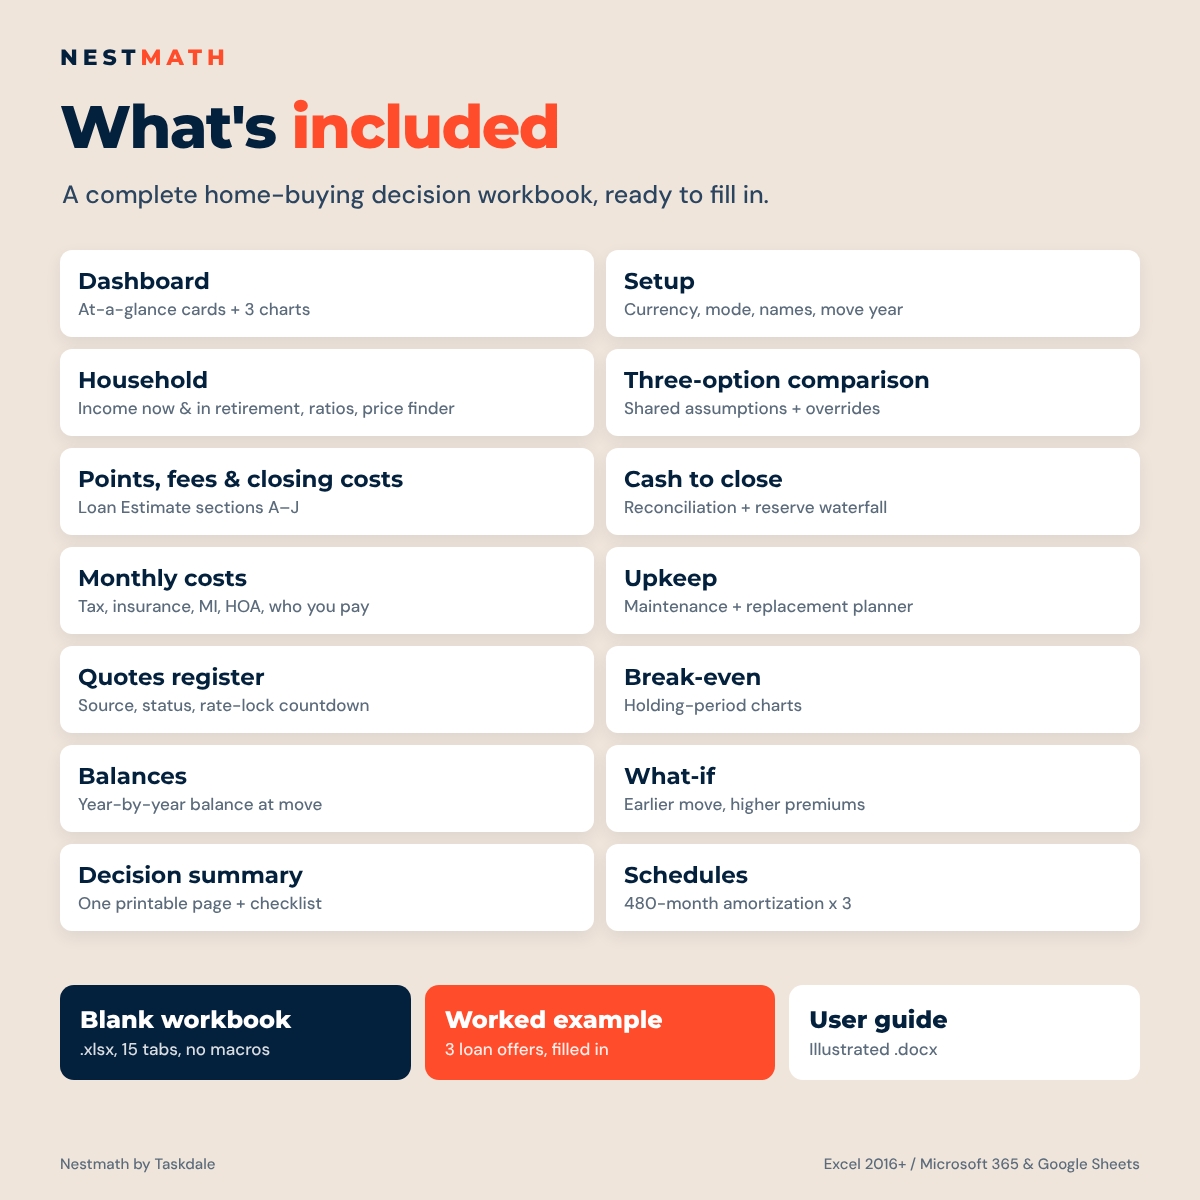
What is included
- Nestmath Home Affordability & Mortgage Offer Dashboard: blank workbook (.xlsx, 15 tabs)
- Worked example workbook: one fictional home with three fictional lender offers, fully filled in
- Illustrated user guide (.docx, 14 pages) with a Loan Estimate field guide, troubleshooting and FAQ
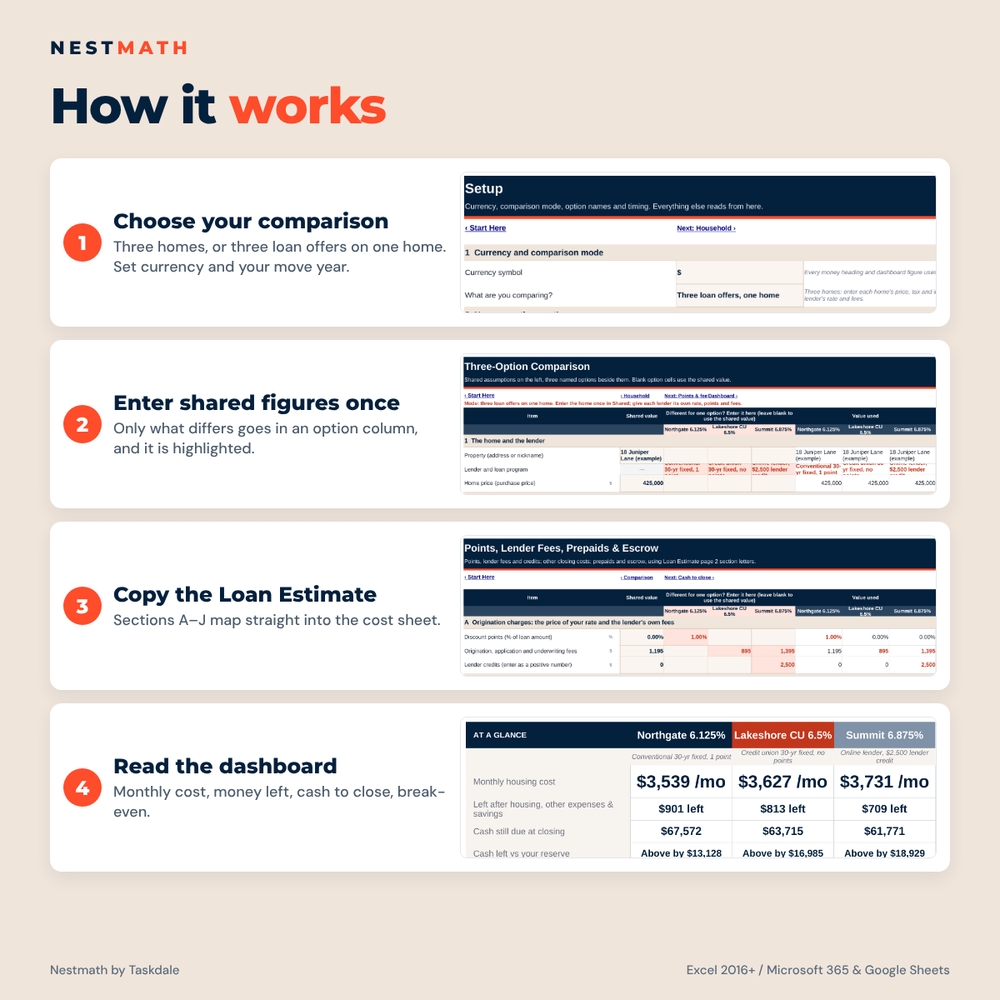
How it works
- On Setup, choose your currency, whether you are comparing three homes or three loan offers, and how many years you expect to keep the home.
- Enter your income, expenses, savings target, cash available and reserve on Household.
- Enter shared assumptions once; put only what differs in each option’s column.
- Copy the figures from each Loan Estimate, insurance quote and tax bill.
- Read the Dashboard, then use Break-Even, Balances, What-If and the Decision page to choose.
Use cases
- Deciding whether 1 point for a 0.375% lower rate is worth it if you might move in five years
- Comparing a lower-priced home with high HOA dues against a pricier home with none
- Checking that you still have an emergency reserve after closing, moving and urgent repairs
- Asking a lender why their cash-to-close figure is higher than your own calculation
File format and requirements
Microsoft Excel 2016 or later (Windows or Mac), Microsoft 365, or a free Google account for Google Sheets. No macros, add-ins or external links. Fixed-rate loans only (up to 40 years); adjustable-rate loans are not modeled. Formula cells are protected without a password, so you can unprotect them to change the design.
Digital download
This is a digital product: nothing is shipped. You can download the files right after purchase. Personal use only. You may not resell, share, or redistribute the files.
For planning and education only; not financial, tax, legal or lending advice. Confirm every figure with your lender, insurer and closing agent. All names in the worked example are fictional.
FAQ
Does it work in Google Sheets?
Yes. Upload the .xlsx to Google Drive and open it with Google Sheets. Every formula uses functions that Excel and Google Sheets share.
Can it tell me how much house I can afford?
The target-price finder estimates the highest price your monthly budget and your cash support, and shows which one limits you. It is a planning estimate, not a pre-approval.
How does it decide if paying points is worth it?
It compares the cumulative financing cost of two offers month by month and reports the first month the lower-rate offer costs less in total, or says that it never does within your comparison period.
Does it calculate PMI removal?
It shows the month the balance first reaches 80% of the purchase price, for reference. You enter the end month your lender confirms.
Can I compare more than three options?
It compares three at a time. Save a copy of the file for another set.
Does it handle adjustable-rate mortgages?
No. It is built for fixed-rate loans up to 40 years.
Can I use a currency other than dollars?
Yes. Change the currency symbol on Setup and every money label updates. Amounts are not converted.

Reviews
There are no reviews yet.